Results of Monitoring at Olkiluoto in 2006 - Environment (pdf) - Posiva
Results of Monitoring at Olkiluoto in 2006 - Environment (pdf) - Posiva
Results of Monitoring at Olkiluoto in 2006 - Environment (pdf) - Posiva

Create successful ePaper yourself
Turn your PDF publications into a flip-book with our unique Google optimized e-Paper software.
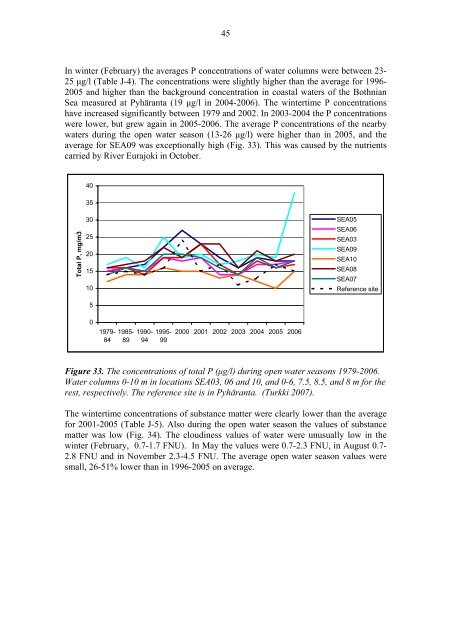
45In w<strong>in</strong>ter (February) the averages P concentr<strong>at</strong>ions <strong>of</strong> w<strong>at</strong>er columns were between 23-25 µg/l (Table J-4). The concentr<strong>at</strong>ions were slightly higher than the average for 1996-2005 and higher than the background concentr<strong>at</strong>ion <strong>in</strong> coastal w<strong>at</strong>ers <strong>of</strong> the BothnianSea measured <strong>at</strong> Pyhäranta (19 µg/l <strong>in</strong> 2004-<strong>2006</strong>). The w<strong>in</strong>tertime P concentr<strong>at</strong>ionshave <strong>in</strong>creased significantly between 1979 and 2002. In 2003-2004 the P concentr<strong>at</strong>ionswere lower, but grew aga<strong>in</strong> <strong>in</strong> 2005-<strong>2006</strong>. The average P concentr<strong>at</strong>ions <strong>of</strong> the nearbyw<strong>at</strong>ers dur<strong>in</strong>g the open w<strong>at</strong>er season (13-26 µg/l) were higher than <strong>in</strong> 2005, and theaverage for SEA09 was exceptionally high (Fig. 33). This was caused by the nutrientscarried by River Eurajoki <strong>in</strong> October.4035Total P, mg/m33025201510SEA05SEA06SEA03SEA09SEA10SEA08SEA07Reference site501979-841985-891990-941995-992000 2001 2002 2003 2004 2005 <strong>2006</strong>Figure 33. The concentr<strong>at</strong>ions <strong>of</strong> total P (µg/l) dur<strong>in</strong>g open w<strong>at</strong>er seasons 1979-<strong>2006</strong>.W<strong>at</strong>er columns 0-10 m <strong>in</strong> loc<strong>at</strong>ions SEA03, 06 and 10, and 0-6, 7.5, 8.5, and 8 m for therest, respectively. The reference site is <strong>in</strong> Pyhäranta. (Turkki 2007).The w<strong>in</strong>tertime concentr<strong>at</strong>ions <strong>of</strong> substance m<strong>at</strong>ter were clearly lower than the averagefor 2001-2005 (Table J-5). Also dur<strong>in</strong>g the open w<strong>at</strong>er season the values <strong>of</strong> substancem<strong>at</strong>ter was low (Fig. 34). The cloud<strong>in</strong>ess values <strong>of</strong> w<strong>at</strong>er were unusually low <strong>in</strong> thew<strong>in</strong>ter (February, 0.7-1.7 FNU). In May the values were 0.7-2.3 FNU, <strong>in</strong> August 0.7-2.8 FNU and <strong>in</strong> November 2.3-4.5 FNU. The average open w<strong>at</strong>er season values weresmall, 26-51% lower than <strong>in</strong> 1996-2005 on average.