Level 2 Strategic Flood Risk Assessment (.pdf ... - Wigan Council
Level 2 Strategic Flood Risk Assessment (.pdf ... - Wigan Council
Level 2 Strategic Flood Risk Assessment (.pdf ... - Wigan Council

You also want an ePaper? Increase the reach of your titles
YUMPU automatically turns print PDFs into web optimized ePapers that Google loves.
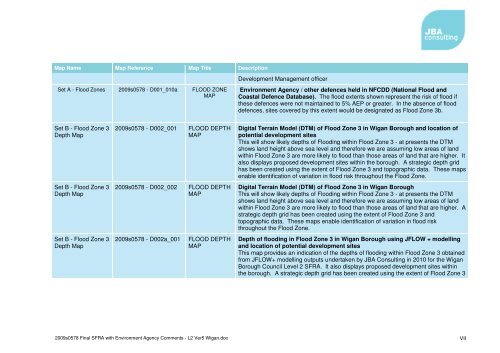
Map Name Map Reference Map Title DescriptionDevelopment Management officerSet A - <strong>Flood</strong> Zones 2009s0578 - D001_010a FLOOD ZONEMAPEnvironment Agency / other defences held in NFCDD (National <strong>Flood</strong> andCoastal Defence Database). The flood extents shown represent the risk of flood ifthese defences were not maintained to 5% AEP or greater. In the absence of flooddefences, sites covered by this extent would be designated as <strong>Flood</strong> Zone 3b.Set B - <strong>Flood</strong> Zone 3Depth Map2009s0578 - D002_001FLOOD DEPTHMAPDigital Terrain Model (DTM) of <strong>Flood</strong> Zone 3 in <strong>Wigan</strong> Borough and location ofpotential development sitesThis will show likely depths of <strong>Flood</strong>ing within <strong>Flood</strong> Zone 3 - at presents the DTMshows land height above sea level and therefore we are assuming low areas of landwithin <strong>Flood</strong> Zone 3 are more likely to flood than those areas of land that are higher. Italso displays proposed development sites within the borough. A strategic depth gridhas been created using the extent of <strong>Flood</strong> Zone 3 and topographic data. These mapsenable identification of variation in flood risk throughout the <strong>Flood</strong> Zone.Set B - <strong>Flood</strong> Zone 3Depth Map2009s0578 - D002_002FLOOD DEPTHMAPDigital Terrain Model (DTM) of <strong>Flood</strong> Zone 3 in <strong>Wigan</strong> BoroughThis will show likely depths of <strong>Flood</strong>ing within <strong>Flood</strong> Zone 3 - at presents the DTMshows land height above sea level and therefore we are assuming low areas of landwithin <strong>Flood</strong> Zone 3 are more likely to flood than those areas of land that are higher. Astrategic depth grid has been created using the extent of <strong>Flood</strong> Zone 3 andtopographic data. These maps enable identification of variation in flood riskthroughout the <strong>Flood</strong> Zone.Set B - <strong>Flood</strong> Zone 3Depth Map2009s0578 - D002a_001FLOOD DEPTHMAPDepth of flooding in <strong>Flood</strong> Zone 3 in <strong>Wigan</strong> Borough using JFLOW + modellingand location of potential development sitesThis map provides an indication of the depths of flooding within <strong>Flood</strong> Zone 3 obtainedfrom JFLOW+ modelling outputs undertaken by JBA Consulting in 2010 for the <strong>Wigan</strong>Borough <strong>Council</strong> <strong>Level</strong> 2 SFRA. It also displays proposed development sites withinthe borough. A strategic depth grid has been created using the extent of <strong>Flood</strong> Zone 32009s0578 Final SFRA with Environment Agency Comments - L2 Ver5 <strong>Wigan</strong>.docVII