Affluence and Food: A Simple Way to Infer Incomes - The University ...
Affluence and Food: A Simple Way to Infer Incomes - The University ...
Affluence and Food: A Simple Way to Infer Incomes - The University ...

Create successful ePaper yourself
Turn your PDF publications into a flip-book with our unique Google optimized e-Paper software.
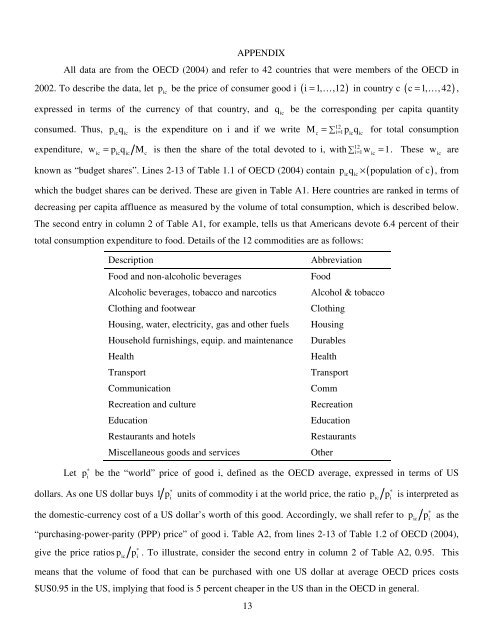
APPENDIXAll data are from the OECD (2004) <strong>and</strong> refer <strong>to</strong> 42 countries that were members of the OECD in2002. To describe the data, leticp be the price of consumer good i ( i = 1, …,12)in country c ( c 1, , 42)= … ,expressed in terms of the currency of that country, <strong>and</strong>qicbe the corresponding per capita quantity12consumed. Thus, picq icis the expenditure on i <strong>and</strong> if we write Mc = ∑ i=1 picqicfor <strong>to</strong>tal consumptionexpenditure, wic = picqic Mcis then the share of the <strong>to</strong>tal devoted <strong>to</strong> i, with ∑ 12i=1wic= 1. <strong>The</strong>se wicareknown as “budget shares”. Lines 2-13 of Table 1.1 of OECD (2004) contain p q ( population of c)icic× , fromwhich the budget shares can be derived. <strong>The</strong>se are given in Table A1. Here countries are ranked in terms ofdecreasing per capita affluence as measured by the volume of <strong>to</strong>tal consumption, which is described below.<strong>The</strong> second entry in column 2 of Table A1, for example, tells us that Americans devote 6.4 percent of their<strong>to</strong>tal consumption expenditure <strong>to</strong> food. Details of the 12 commodities are as follows:Description<strong>Food</strong> <strong>and</strong> non-alcoholic beveragesAlcoholic beverages, <strong>to</strong>bacco <strong>and</strong> narcoticsClothing <strong>and</strong> footwearHousing, water, electricity, gas <strong>and</strong> other fuelsHousehold furnishings, equip. <strong>and</strong> maintenanceHealthTransportCommunicationRecreation <strong>and</strong> cultureEducationRestaurants <strong>and</strong> hotelsMiscellaneous goods <strong>and</strong> servicesAbbreviation<strong>Food</strong>Alcohol & <strong>to</strong>baccoClothingHousingDurablesHealthTransportCommRecreationEducationRestaurantsOtherLetp ∗ibe the “world” price of good i, defined as the OECD average, expressed in terms of USdollars. As one US dollar buys1 p ∗ iunits of commodity i at the world price, the ratio pic p ∗ iis interpreted asthe domestic-currency cost of a US dollar’s worth of this good. Accordingly, we shall refer <strong>to</strong> picp ∗ ias the“purchasing-power-parity (PPP) price” of good i. Table A2, from lines 2-13 of Table 1.2 of OECD (2004),give the price ratios p icp ∗ . To illustrate, consider the second entry in column 2 of Table A2, 0.95. Thisimeans that the volume of food that can be purchased with one US dollar at average OECD prices costs$US0.95 in the US, implying that food is 5 percent cheaper in the US than in the OECD in general.13