Affluence and Food: A Simple Way to Infer Incomes - The University ...
Affluence and Food: A Simple Way to Infer Incomes - The University ...
Affluence and Food: A Simple Way to Infer Incomes - The University ...

Create successful ePaper yourself
Turn your PDF publications into a flip-book with our unique Google optimized e-Paper software.
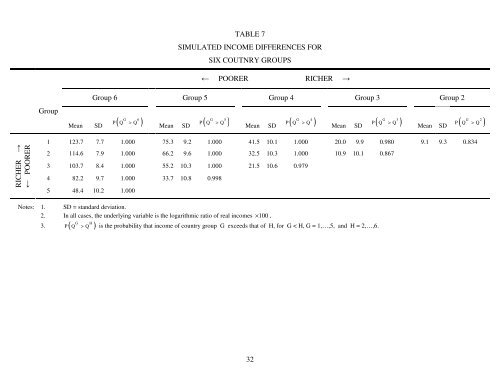
TABLE 7SIMULATED INCOME DIFFERENCES FORSIX COUTNRY GROUPS← POORER RICHER →GroupGroup 6 Group 5 Group 4 Group 3 Group 2Mean SD( )P Q G > Q 6Mean SD( )P Q G > Q 5Mean SD( )P Q G > Q 4Mean SD( )P Q G > Q 3Mean SD( )P Q G > Q 2RICHER →← POORER1 123.7 7.7 1.000 75.3 9.2 1.000 41.5 10.1 1.000 20.0 9.9 0.980 9.1 9.3 0.8342 114.6 7.9 1.000 66.2 9.6 1.000 32.5 10.3 1.000 10.9 10.1 0.8673 103.7 8.4 1.000 55.2 10.3 1.000 21.5 10.6 0.9794 82.2 9.7 1.000 33.7 10.8 0.9985 48.4 10.2 1.000Notes: 1. SD = st<strong>and</strong>ard deviation.2. In all cases, the underlying variable is the logarithmic ratio of real incomes × 100 .3. ( G HP Q Q )> is the probability that income of country group G exceeds that of H, for G < H, G = 1,…,5, <strong>and</strong> H = 2,…,6.32