Affluence and Food: A Simple Way to Infer Incomes - The University ...
Affluence and Food: A Simple Way to Infer Incomes - The University ...
Affluence and Food: A Simple Way to Infer Incomes - The University ...

Create successful ePaper yourself
Turn your PDF publications into a flip-book with our unique Google optimized e-Paper software.
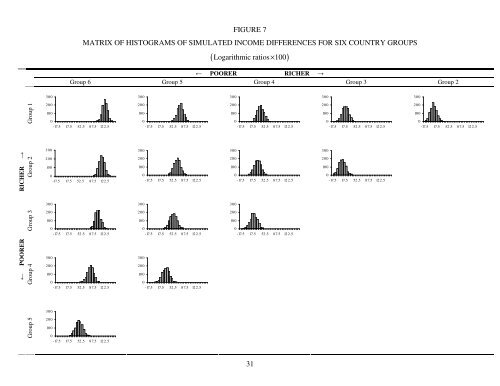
FIGURE 7MATRIX OF HISTOGRAMS OF SIMULATED INCOME DIFFERENCES FOR SIX COUNTRY GROUPS( Logarithmic ratios × 100)← POORER RICHER →Group 6 Group 5 Group 4 Group 3 Group 2300300300300300Group 12001000-17.5 17.5 52.5 87.5 122.52001000-17.5 17.5 52.5 87.5 122.52001000-17.5 17.5 52.5 87.5 122.52001000-17.5 17.5 52.5 87.5 122.52001000-17.5 17.5 52.5 87.5 122.5300300300300← POORER RICHER →Group 4Group 3Group 22001000-17.5 17.5 52.5 87.5 122.53002001000-17.5 17.5 52.5 87.5 122.53002001000-17.5 17.5 52.5 87.5 122.52001000-17.5 17.5 52.5 87.5 122.53002001000-17.5 17.5 52.5 87.5 122.53002001000-17.5 17.5 52.5 87.5 122.52001000-17.5 17.5 52.5 87.5 122.53002001000-17.5 17.5 52.5 87.5 122.52001000-17.5 17.5 52.5 87.5 122.5300Group 52001000-17.5 17.5 52.5 87.5 122.531