REFERENCESBarlow, R. (1977). “A Test of Alternative Methods of Making GNP Comparisons.” Economic Journal 87: 450-59.Bennett, M. K. (1951). “International Disparities in Consumption Levels.” American Economic Review 41: 632-49.Beckerman, W., <strong>and</strong> R. Bacon (1966). “International Comparisons of Income Levels: A Suggested New Measure.”Economic Journal 76: 519-36.Chua, G. (2003). “<strong>Food</strong> <strong>and</strong> Cross-Country Income Comparisons.” Economics Discussion Paper No 03.14, BusinessSchool, <strong>The</strong> <strong>University</strong> of Western Australia.Costa, D. L. (2001). “Estimating Real Income in the United States from 1888 <strong>to</strong> 1994: Correcting CPI Bias UsingEngel Curves.” Journal of Political Economy 109: 1288-1310.Duggar, J. W. (1969). “International Comparisons of Income Levels: An Additional Measure.” Economic Journal79: 109-16.Engel, E. (1857). “Die Productions- und Consumptionsverhaltnisse des Konigreichs Sachsen.” Reprinted in Engel’sDie Lebenskosten belgischer Atbeiter-Familien. Dresden, 1895.Ehrlich, E. (1969). “Dynamic International Comparison of National <strong>Incomes</strong> Expressed in Terms of PhysicalIndica<strong>to</strong>rs.” Osteuropa Wirtschaft 14, 1.Hamil<strong>to</strong>n B. W. (2001). “Using Engel’s Law <strong>to</strong> Estimate CPI Bias.” American Economic Review 91: 619-30.Hes<strong>to</strong>n, A. (1973). “A Comparison of Some Short-Cut Methods of Estimating Real Product Per Capita.” Review ofIncome <strong>and</strong> Wealth 19: 79-104.Janossy, F. (1963). A Gazdasagi Fejlettseg Merhe<strong>to</strong>sege es uj Meresi Modszere. (<strong>The</strong> Measurability <strong>and</strong> a NewMeasuring Method of Economic Development Level.) Budapest: Kozgazdasagi es Jogi Konyvkiado.Leser, C. E. V. (1963). “Forms of Engel Functions.” Econometrica 31: 694-703.OECD (2004). Purchasing Power Parities <strong>and</strong> Real Expenditures: 2002 Benchmark Year. Paris: Eurostat <strong>and</strong>OECD.Nakamura, L. (1996). “Is US Economic Performance Really that Bad?” Working Paper No 95, Federal Reserve Bankof Philadelphia.Orshansky, M. (1965). “Counting the Poor: Another Look at the Poverty Profile.” Social Security Bulletin 28: 3-29.Orshansky, M. (1969). “How Poverty is Measured.” Monthly Labor Review 92: 37-41.Rao, V. V. B. (1981). “Measurement of Deprivation <strong>and</strong> Poverty Based on the Proportion Spent on <strong>Food</strong>: AnExplora<strong>to</strong>ry Exercise.” World Development 9: 337-53.Sahn, D. A., <strong>and</strong> D. Stifel (2003). “Exploring Alternative Measures of Welfare in the Absence of Expenditure Data.”Review of Income <strong>and</strong> Wealth 49: 463-89.Steckel, R. H. (1995). “Stature <strong>and</strong> the St<strong>and</strong>ard of Living.” Journal of Economic Literature 33: 1903-40.Stigler, G. J. (1954). “<strong>The</strong> Early His<strong>to</strong>ry of Empirical Studies in Consumer Behaviour.” Journal of Political Economy62: 95-113.<strong>The</strong>il, H. (1975/76). <strong>The</strong>ory <strong>and</strong> Measurement of Consumer Dem<strong>and</strong>. Two volumes. Amsterdam: North-Holl<strong>and</strong>.<strong>The</strong>il, H. (1980). <strong>The</strong> System-Wide Approach <strong>to</strong> Microeconomics. Chicago: <strong>The</strong> <strong>University</strong> of Chicago Press.<strong>The</strong>il, H., C.-F. Chung <strong>and</strong> J. L. Seale Jr (1989). International Evidence on Consumption Patterns. Greenwich, Conn.:JAI Press.<strong>The</strong>il, H., <strong>and</strong> K. W. Clements (1987). Applied Dem<strong>and</strong> Analysis: Results from System-Wide Approaches.Cambridge Mass.: Ballinger Publishing Co.Van Praag, B. M. S., J. S. Spit <strong>and</strong> H. Van de Stadt (1982). “A Comparison between the <strong>Food</strong> Ratio Poverty Line <strong>and</strong>the Leyden Poverty Line.” Review of Economics <strong>and</strong> Statistics 64: 691-94.Working, H. (1943). “Statistical Laws of Family Expenditure.” Journal of the American Statistical Association 38:43-56.18
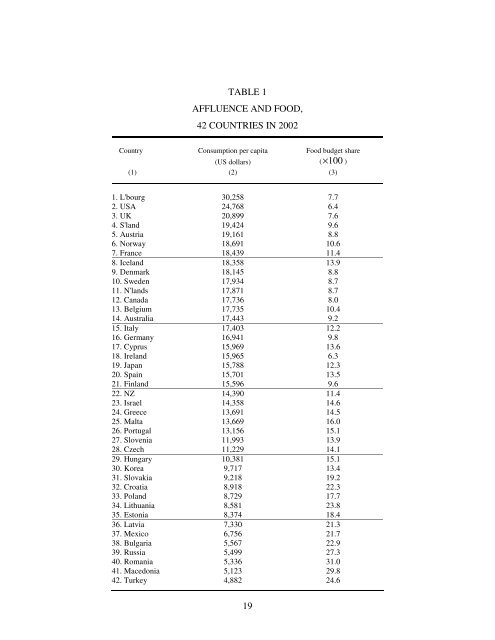
TABLE 1AFFLUENCE AND FOOD,42 COUNTRIES IN 2002Country Consumption per capita <strong>Food</strong> budget share(US dollars) ( × 100 )(1) (2) (3)1. L'bourg 30,258 7.72. USA 24,768 6.43. UK 20,899 7.64. S'l<strong>and</strong> 19,424 9.65. Austria 19,161 8.86. Norway 18,691 10.67. France 18,439 11.48. Icel<strong>and</strong> 18,358 13.99. Denmark 18,145 8.810. Sweden 17,934 8.711. N'l<strong>and</strong>s 17,871 8.712. Canada 17,736 8.013. Belgium 17,735 10.414. Australia 17,443 9.215. Italy 17,403 12.216. Germany 16,941 9.817. Cyprus 15,969 13.618. Irel<strong>and</strong> 15,965 6.319. Japan 15,788 12.320. Spain 15,701 13.521. Finl<strong>and</strong> 15,596 9.622. NZ 14,390 11.423. Israel 14,358 14.624. Greece 13,691 14.525. Malta 13,669 16.026. Portugal 13,156 15.127. Slovenia 11,993 13.928. Czech 11,229 14.129. Hungary 10,381 15.130. Korea 9,717 13.431. Slovakia 9,218 19.232. Croatia 8,918 22.333. Pol<strong>and</strong> 8,729 17.734. Lithuania 8,581 23.835. Es<strong>to</strong>nia 8,374 18.436. Latvia 7,330 21.337. Mexico 6,756 21.738. Bulgaria 5,567 22.939. Russia 5,499 27.340. Romania 5,336 31.041. Macedonia 5,123 29.842. Turkey 4,882 24.619