Affluence and Food: A Simple Way to Infer Incomes - The University ...
Affluence and Food: A Simple Way to Infer Incomes - The University ...
Affluence and Food: A Simple Way to Infer Incomes - The University ...

You also want an ePaper? Increase the reach of your titles
YUMPU automatically turns print PDFs into web optimized ePapers that Google loves.
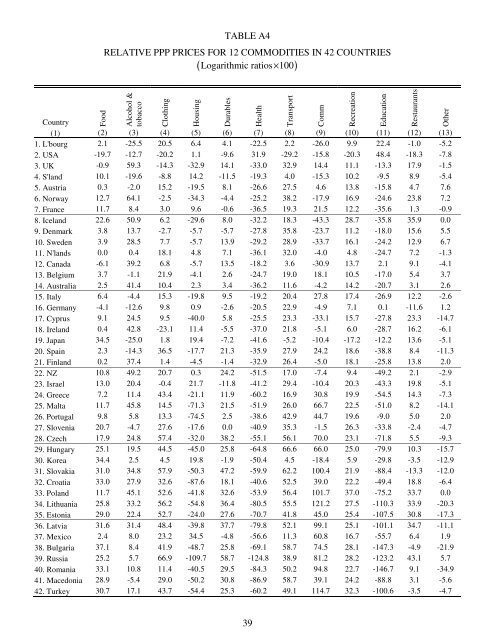
TABLE A4RELATIVE PPP PRICES FOR 12 COMMODITIES IN 42 COUNTRIESLogarithmic ratios×100( )<strong>Food</strong>Alcohol &<strong>to</strong>baccoClothingHousingDurablesCountry(1) (2) (3) (4) (5) (6) (7) (8) (9) (10) (11) (12) (13)1. L'bourg 2.1 -25.5 20.5 6.4 4.1 -22.5 2.2 -26.0 9.9 22.4 -1.0 -5.22. USA -19.7 -12.7 -20.2 1.1 -9.6 31.9 -29.2 -15.8 -20.3 48.4 -18.3 -7.83. UK -0.9 59.3 -14.3 -32.9 14.1 -33.0 32.9 14.4 11.1 -13.3 17.9 -1.54. S'l<strong>and</strong> 10.1 -19.6 -8.8 14.2 -11.5 -19.3 4.0 -15.3 10.2 -9.5 8.9 -5.45. Austria 0.3 -2.0 15.2 -19.5 8.1 -26.6 27.5 4.6 13.8 -15.8 4.7 7.66. Norway 12.7 64.1 -2.5 -34.3 -4.4 -25.2 38.2 -17.9 16.9 -24.6 23.8 7.27. France 11.7 8.4 3.0 9.6 -0.6 -36.5 19.3 21.5 12.2 -35.6 1.3 -0.98. Icel<strong>and</strong> 22.6 50.9 6.2 -29.6 8.0 -32.2 18.3 -43.3 28.7 -35.8 35.9 0.09. Denmark 3.8 13.7 -2.7 -5.7 -5.7 -27.8 35.8 -23.7 11.2 -18.0 15.6 5.510. Sweden 3.9 28.5 7.7 -5.7 13.9 -29.2 28.9 -33.7 16.1 -24.2 12.9 6.711. N'l<strong>and</strong>s 0.0 0.4 18.1 4.8 7.1 -36.1 32.0 -4.0 4.8 -24.7 7.2 -1.312. Canada -6.1 39.2 6.8 -5.7 13.5 -18.2 3.6 -30.9 13.7 2.1 9.1 -4.113. Belgium 3.7 -1.1 21.9 -4.1 2.6 -24.7 19.0 18.1 10.5 -17.0 5.4 3.714. Australia 2.5 41.4 10.4 2.3 3.4 -36.2 11.6 -4.2 14.2 -20.7 3.1 2.615. Italy 6.4 -4.4 15.3 -19.8 9.5 -19.2 20.4 27.8 17.4 -26.9 12.2 -2.616. Germany -4.1 -12.6 9.8 0.9 -2.6 -20.5 22.9 -4.9 7.1 0.1 -11.6 1.217. Cyprus 9.1 24.5 9.5 -40.0 5.8 -25.5 23.3 -33.1 15.7 -27.8 23.3 -14.718. Irel<strong>and</strong> 0.4 42.8 -23.1 11.4 -5.5 -37.0 21.8 -5.1 6.0 -28.7 16.2 -6.119. Japan 34.5 -25.0 1.8 19.4 -7.2 -41.6 -5.2 -10.4 -17.2 -12.2 13.6 -5.120. Spain 2.3 -14.3 36.5 -17.7 21.3 -35.9 27.9 24.2 18.6 -38.8 8.4 -11.321. Finl<strong>and</strong> 0.2 37.4 1.4 -4.5 -1.4 -32.9 26.4 -5.0 18.1 -25.8 13.8 2.022. NZ 10.8 49.2 20.7 0.3 24.2 -51.5 17.0 -7.4 9.4 -49.2 2.1 -2.923. Israel 13.0 20.4 -0.4 21.7 -11.8 -41.2 29.4 -10.4 20.3 -43.3 19.8 -5.124. Greece 7.2 11.4 43.4 -21.1 11.9 -60.2 16.9 30.8 19.9 -54.5 14.3 -7.325. Malta 11.7 45.8 14.5 -71.3 21.5 -51.9 26.0 66.7 22.5 -51.0 8.2 -14.126. Portugal 9.8 5.8 13.3 -74.5 2.5 -38.6 42.9 44.7 19.6 -9.0 5.0 2.027. Slovenia 20.7 -4.7 27.6 -17.6 0.0 -40.9 35.3 -1.5 26.3 -33.8 -2.4 -4.728. Czech 17.9 24.8 57.4 -32.0 38.2 -55.1 56.1 70.0 23.1 -71.8 5.5 -9.329. Hungary 25.1 19.5 44.5 -45.0 25.8 -64.8 66.6 66.0 25.0 -79.9 10.3 -15.730. Korea 34.4 2.5 4.5 19.8 -1.9 -50.4 4.5 -18.4 5.9 -29.8 -3.5 -12.931. Slovakia 31.0 34.8 57.9 -50.3 47.2 -59.9 62.2 100.4 21.9 -88.4 -13.3 -12.032. Croatia 33.0 27.9 32.6 -87.6 18.1 -40.6 52.5 39.0 22.2 -49.4 18.8 -6.433. Pol<strong>and</strong> 11.7 45.1 52.6 -41.8 32.6 -53.9 56.4 101.7 37.0 -75.2 33.7 0.034. Lithuania 25.8 33.2 56.2 -54.8 36.4 -80.5 55.5 121.2 27.5 -110.3 33.9 -20.335. Es<strong>to</strong>nia 29.0 22.4 52.7 -24.0 27.6 -70.7 41.8 45.0 25.4 -107.5 30.8 -17.336. Latvia 31.6 31.4 48.4 -39.8 37.7 -79.8 52.1 99.1 25.1 -101.1 34.7 -11.137. Mexico 2.4 8.0 23.2 34.5 -4.8 -56.6 11.3 60.8 16.7 -55.7 6.4 1.938. Bulgaria 37.1 8.4 41.9 -48.7 25.8 -69.1 58.7 74.5 28.1 -147.3 -4.9 -21.939. Russia 25.2 5.7 66.9 -109.7 58.7 -124.8 38.9 81.2 28.2 -123.2 43.1 5.740. Romania 33.1 10.8 11.4 -40.5 29.5 -84.3 50.2 94.8 22.7 -146.7 9.1 -34.941. Macedonia 28.9 -5.4 29.0 -50.2 30.8 -86.9 58.7 39.1 24.2 -88.8 3.1 -5.642. Turkey 30.7 17.1 43.7 -54.4 25.3 -60.2 49.1 114.7 32.3 -100.6 -3.5 -4.7HealthTransportCommRecreationEducationRestaurantsOther39