- Page 1 and 2:
VTI notat 56A • 2003VTI notat 56A
- Page 3 and 4:
ContentsPageAbbrivations and Notati
- Page 5 and 6:
10.5.1 Transitions 5311 Evaluation
- Page 7 and 8:
Abbrivations and NotationsAEAT AEA
- Page 9 and 10:
chosen test track with a minimum of
- Page 11 and 12:
1.8.2 ModelsThree different models
- Page 13 and 14:
3 What does comfort mean in the con
- Page 15 and 16:
Representation of passengers’ opi
- Page 17 and 18:
4 How comfort evolves with speed4.1
- Page 19 and 20:
Each element may provoke a potentia
- Page 21 and 22:
5.2.2 Theoretical behaviour of thos
- Page 23 and 24:
Nominal acceleration in the horizon
- Page 25 and 26:
6 Actual evaluation rulesAll the fo
- Page 27 and 28:
Important variancesS 0 = var(y)Sr =
- Page 29 and 30:
7 Choice of the test zone7.1 Choice
- Page 31 and 32:
9.008.007.006.00roll velocity5.004.
- Page 33 and 34:
8 Description of the test8.1 The tr
- Page 35 and 36:
8.3.3 Synchronisation between votes
- Page 37 and 38:
8.5 Registration of data, calculati
- Page 39 and 40:
DRIVER CAB8.6.2 Occupied places2224
- Page 41 and 42:
9.3 Study of the car body angle9.3.
- Page 43 and 44:
9.4.2 Influence of length of the co
- Page 45 and 46:
9.4.4 Additional discomfort due to
- Page 47 and 48:
10.1.1 ConclusionsThe actual distri
- Page 49 and 50:
10.3 Seat positionThe influence of
- Page 51 and 52:
Average votes for the different tra
- Page 53 and 54:
Figures 10-5 to 10-10 show the infl
- Page 55 and 56:
Influence by roll velocity on voteA
- Page 57 and 58:
5.0Influence by Pct on voteAll cate
- Page 59 and 60:
11 Evaluation of local comfort11.1
- Page 61 and 62: 11.1.4 Scaling of votesThe N’ VA
- Page 63 and 64: Note that very high values of later
- Page 65 and 66: 554433N'vaN'va221100 1 2 3 4Lateral
- Page 68 and 69: Multiple regressions have therefore
- Page 70 and 71: With the 1.0-second window, the jer
- Page 72 and 73: The regression has been repeated wi
- Page 74 and 75: (Table 11-12)Object: Simple and adj
- Page 76 and 77: simple transitions, and with the re
- Page 78 and 79: Table 11-18 Regression for track en
- Page 80 and 81: Some characteristic data points of
- Page 82 and 83: The probability that all coefficien
- Page 84 and 85: Second conclusionThis also proves t
- Page 86 and 87: number of real votes3025201510500,2
- Page 88 and 89: 11.2.2 ParametersFour parameters we
- Page 90 and 91: There are some observations from th
- Page 92 and 93: Table 11-30 Two-parameter regressio
- Page 94 and 95: Three-parameter regression - N'VA,
- Page 96 and 97: The three-parameter regression was
- Page 98 and 99: 12 Evaluation of average comfort12.
- Page 100 and 101: Table 12-2 shows that the correlati
- Page 102 and 103: 3.53.5332.52.5NVA21.5NVA21.5110.50.
- Page 104 and 105: Table 12-5 Multiple regression for
- Page 106 and 107: This is the preferred result to be
- Page 108 and 109: 12.2.5 Density of importance of eac
- Page 110 and 111: 13.3 Conclusions in relationship wi
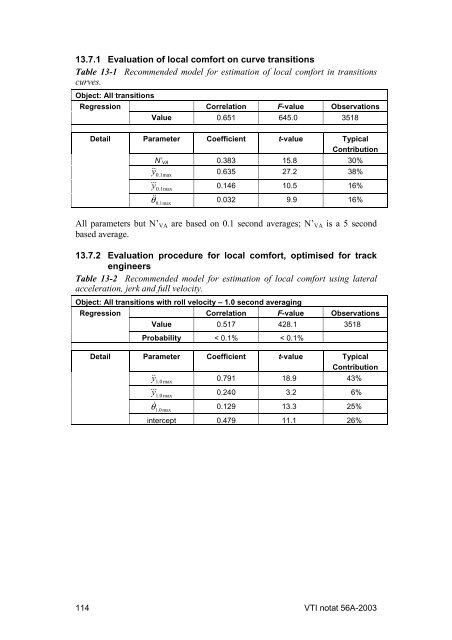
- Page 114 and 115: 13.7.3 Evaluation of local comfort
- Page 116 and 117: Appendix 1Page 1 (3)1 Preparing the
- Page 118 and 119: Appendix 1Page 3 (3)2.5 Publish res
- Page 120 and 121: Appendix 2Page 2 (10)For this progr
- Page 122 and 123: Appendix 2Page 4 (10)Vertical accel
- Page 124 and 125: Appendix 2Page 6 (10)Influence of l
- Page 126 and 127: Appendix 2Page 8 (10)Red line : 0.1
- Page 128 and 129: Appendix 2Page 10 (10)Study of aver
- Page 130: Appendix 3Page 2 (2)Evaluation of h


