UIC comfort tests - VTI
UIC comfort tests - VTI
UIC comfort tests - VTI
Create successful ePaper yourself
Turn your PDF publications into a flip-book with our unique Google optimized e-Paper software.
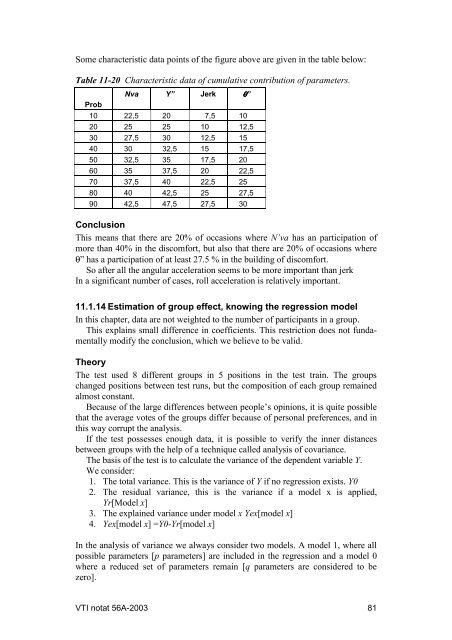
Some characteristic data points of the figure above are given in the table below:Table 11-20 Characteristic data of cumulative contribution of parameters.Nva Y” Jerk θ”Prob10 22,5 20 7,5 1020 25 25 10 12,530 27,5 30 12,5 1540 30 32,5 15 17,550 32,5 35 17,5 2060 35 37,5 20 22,570 37,5 40 22,5 2580 40 42,5 25 27,590 42,5 47,5 27,5 30ConclusionThis means that there are 20% of occasions where N’va has an participation ofmore than 40% in the dis<strong>comfort</strong>, but also that there are 20% of occasions whereθ” has a participation of at least 27.5 % in the building of dis<strong>comfort</strong>.So after all the angular acceleration seems to be more important than jerkIn a significant number of cases, roll acceleration is relatively important.11.1.14 Estimation of group effect, knowing the regression modelIn this chapter, data are not weighted to the number of participants in a group.This explains small difference in coefficients. This restriction does not fundamentallymodify the conclusion, which we believe to be valid.TheoryThe test used 8 different groups in 5 positions in the test train. The groupschanged positions between test runs, but the composition of each group remainedalmost constant.Because of the large differences between people’s opinions, it is quite possiblethat the average votes of the groups differ because of personal preferences, and inthis way corrupt the analysis.If the test possesses enough data, it is possible to verify the inner distancesbetween groups with the help of a technique called analysis of covariance.The basis of the test is to calculate the variance of the dependent variable Y.We consider:1. The total variance. This is the variance of Y if no regression exists. Y02. The residual variance, this is the variance if a model x is applied,Yr[Model x]3. The explained variance under model x Yex[model x]4. Yex[model x] =Y0-Yr[model x]In the analysis of variance we always consider two models. A model 1, where allpossible parameters [p parameters] are included in the regression and a model 0where a reduced set of parameters remain [q parameters are considered to bezero].<strong>VTI</strong> notat 56A-2003 81


