UIC comfort tests - VTI
UIC comfort tests - VTI
UIC comfort tests - VTI

You also want an ePaper? Increase the reach of your titles
YUMPU automatically turns print PDFs into web optimized ePapers that Google loves.
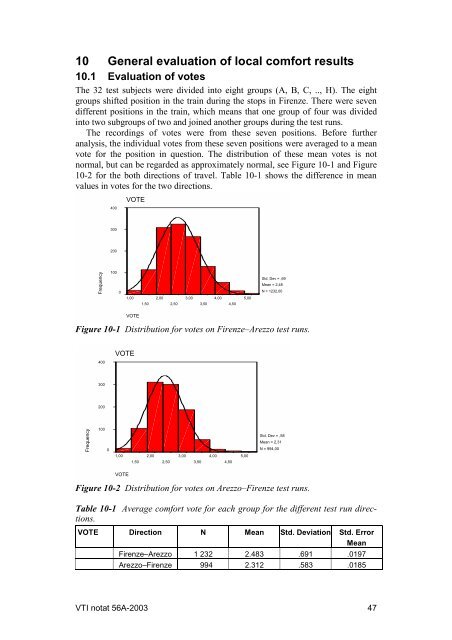
10 General evaluation of local <strong>comfort</strong> results10.1 Evaluation of votesThe 32 test subjects were divided into eight groups (A, B, C, .., H). The eightgroups shifted position in the train during the stops in Firenze. There were sevendifferent positions in the train, which means that one group of four was dividedinto two subgroups of two and joined another groups during the test runs.The recordings of votes were from these seven positions. Before furtheranalysis, the individual votes from these seven positions were averaged to a meanvote for the position in question. The distribution of these mean votes is notnormal, but can be regarded as approximately normal, see Figure 10-1 and Figure10-2 for the both directions of travel. Table 10-1 shows the difference in meanvalues in votes for the two directions.400VOTE300200Frequency10001,001,502,002,503,003,504,004,505,00Std. Dev = ,69Mean = 2,48N = 1232,00VOTEFigure 10-1 Distribution for votes on Firenze–Arezzo test runs.400VOTE300200Frequency10001,001,502,002,503,003,504,004,505,00Std. Dev = ,58Mean = 2,31N = 994,00VOTEFigure 10-2 Distribution for votes on Arezzo–Firenze test runs.Table 10-1 Average <strong>comfort</strong> vote for each group for the different test run directions.VOTE Direction N Mean Std. Deviation Std. ErrorMeanFirenze–Arezzo 1 232 2.483 .691 .0197Arezzo–Firenze 994 2.312 .583 .0185<strong>VTI</strong> notat 56A-2003 47