UIC comfort tests - VTI
UIC comfort tests - VTI
UIC comfort tests - VTI

You also want an ePaper? Increase the reach of your titles
YUMPU automatically turns print PDFs into web optimized ePapers that Google loves.
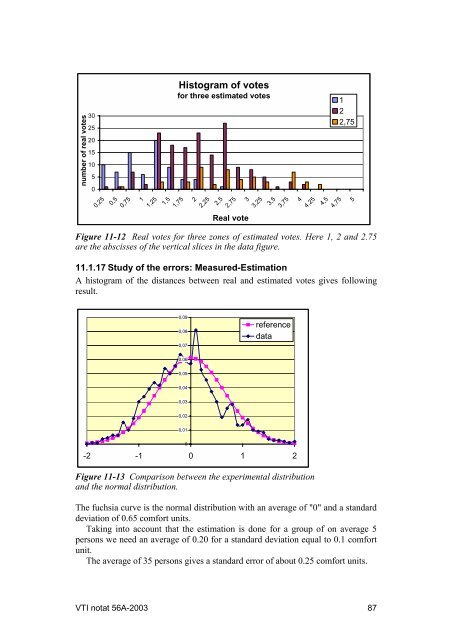
number of real votes3025201510500,250,50,7511,251,5Histogram of votesfor three estimated votes1,7522,252,52,75Real vote33,253,53,7544,254,5122,754,755Figure 11-12 Real votes for three zones of estimated votes. Here 1, 2 and 2.75are the abscisses of the vertical slices in the data figure.11.1.17 Study of the errors: Measured-EstimationA histogram of the distances between real and estimated votes gives followingresult.0,090,080,07referencedata0,060,050,040,030,020,010-2 -1 0 1 2Figure 11-13 Comparison between the experimental distributionand the normal distribution.The fuchsia curve is the normal distribution with an average of "0" and a standarddeviation of 0.65 <strong>comfort</strong> units.Taking into account that the estimation is done for a group of on average 5persons we need an average of 0.20 for a standard deviation equal to 0.1 <strong>comfort</strong>unit.The average of 35 persons gives a standard error of about 0.25 <strong>comfort</strong> units.<strong>VTI</strong> notat 56A-2003 87