UIC comfort tests - VTI
UIC comfort tests - VTI
UIC comfort tests - VTI

Create successful ePaper yourself
Turn your PDF publications into a flip-book with our unique Google optimized e-Paper software.
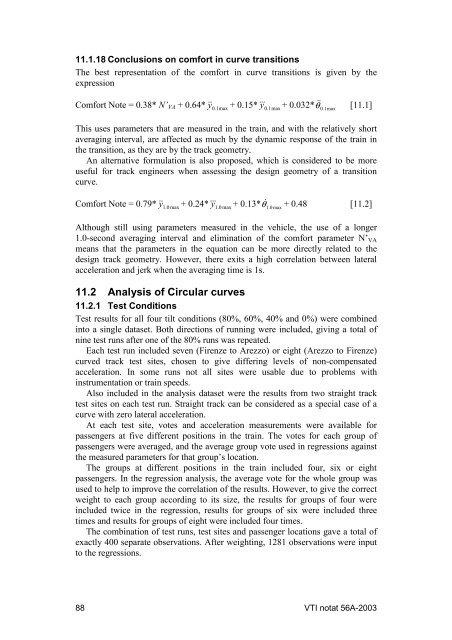
11.1.18 Conclusions on <strong>comfort</strong> in curve transitionsThe best representation of the <strong>comfort</strong> in curve transitions is given by theexpressionComfort Note = 0.38* N’ VA + 0.64* & y& 0.1 max+ 0.15* & y& 0.1 max+ 0.032* & θ 0.1max[11.1]This uses parameters that are measured in the train, and with the relatively shortaveraging interval, are affected as much by the dynamic response of the train inthe transition, as they are by the track geometry.An alternative formulation is also proposed, which is considered to be moreuseful for track engineers when assessing the design geometry of a transitioncurve.Comfort Note = 0.79* & y& 1.0 max+ 0.24* & y&1.0 max+ 0.13* & θ1.0 max+ 0.48 [11.2]Although still using parameters measured in the vehicle, the use of a longer1.0-second averaging interval and elimination of the <strong>comfort</strong> parameter N’ VAmeans that the parameters in the equation can be more directly related to thedesign track geometry. However, there exits a high correlation between lateralacceleration and jerk when the averaging time is 1s.11.2 Analysis of Circular curves11.2.1 Test ConditionsTest results for all four tilt conditions (80%, 60%, 40% and 0%) were combinedinto a single dataset. Both directions of running were included, giving a total ofnine test runs after one of the 80% runs was repeated.Each test run included seven (Firenze to Arezzo) or eight (Arezzo to Firenze)curved track test sites, chosen to give differing levels of non-compensatedacceleration. In some runs not all sites were usable due to problems withinstrumentation or train speeds.Also included in the analysis dataset were the results from two straight tracktest sites on each test run. Straight track can be considered as a special case of acurve with zero lateral acceleration.At each test site, votes and acceleration measurements were available forpassengers at five different positions in the train. The votes for each group ofpassengers were averaged, and the average group vote used in regressions againstthe measured parameters for that group’s location.The groups at different positions in the train included four, six or eightpassengers. In the regression analysis, the average vote for the whole group wasused to help to improve the correlation of the results. However, to give the correctweight to each group according to its size, the results for groups of four wereincluded twice in the regression, results for groups of six were included threetimes and results for groups of eight were included four times.The combination of test runs, test sites and passenger locations gave a total ofexactly 400 separate observations. After weighting, 1281 observations were inputto the regressions.88 <strong>VTI</strong> notat 56A-2003