

Household Income and Expenditure Survey Analysis Report
Household Income and Expenditure Survey Analysis Report
Household Income and Expenditure Survey Analysis Report

Create successful ePaper yourself
Turn your PDF publications into a flip-book with our unique Google optimized e-Paper software.
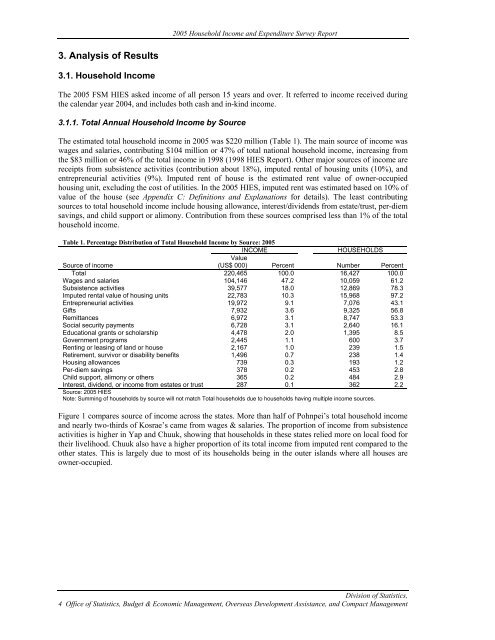
2005 <strong>Household</strong> <strong>Income</strong> <strong>and</strong> <strong>Expenditure</strong> <strong>Survey</strong> <strong>Report</strong>3. <strong>Analysis</strong> of Results3.1. <strong>Household</strong> <strong>Income</strong>The 2005 FSM HIES asked income of all person 15 years <strong>and</strong> over. It referred to income received duringthe calendar year 2004, <strong>and</strong> includes both cash <strong>and</strong> in-kind income.3.1.1. Total Annual <strong>Household</strong> <strong>Income</strong> by SourceThe estimated total household income in 2005 was $220 million (Table 1). The main source of income waswages <strong>and</strong> salaries, contributing $104 million or 47% of total national household income, increasing fromthe $83 million or 46% of the total income in 1998 (1998 HIES <strong>Report</strong>). Other major sources of income arereceipts from subsistence activities (contribution about 18%), imputed rental of housing units (10%), <strong>and</strong>entrepreneurial activities (9%). Imputed rent of house is the estimated rent value of owner-occupiedhousing unit, excluding the cost of utilities. In the 2005 HIES, imputed rent was estimated based on 10% ofvalue of the house (see Appendix C: Definitions <strong>and</strong> Explanations for details). The least contributingsources to total household income include housing allowance, interest/dividends from estate/trust, per-diemsavings, <strong>and</strong> child support or alimony. Contribution from these sources comprised less than 1% of the totalhousehold income.Table 1. Percentage Distribution of Total <strong>Household</strong> <strong>Income</strong> by Source: 2005INCOMEHOUSEHOLDSValue(US$ 000) Percent Number PercentSource of incomeTotal 220,465 100.0 16,427 100.0Wages <strong>and</strong> salaries 104,146 47.2 10,059 61.2Subsistence activities 39,577 18.0 12,869 78.3Imputed rental value of housing units 22,783 10.3 15,968 97.2Entrepreneurial activities 19,972 9.1 7,076 43.1Gifts 7,932 3.6 9,325 56.8Remittances 6,972 3.1 8,747 53.3Social security payments 6,728 3.1 2,640 16.1Educational grants or scholarship 4,478 2.0 1,395 8.5Government programs 2,445 1.1 600 3.7Renting or leasing of l<strong>and</strong> or house 2,167 1.0 239 1.5Retirement, survivor or disability benefits 1,496 0.7 238 1.4Housing allowances 739 0.3 193 1.2Per-diem savings 378 0.2 453 2.8Child support, alimony or others 365 0.2 484 2.9Interest, dividend, or income from estates or trust 287 0.1 362 2.2Source: 2005 HIESNote: Summing of households by source will not match Total households due to households having multiple income sources.Figure 1 compares source of income across the states. More than half of Pohnpei’s total household income<strong>and</strong> nearly two-thirds of Kosrae’s came from wages & salaries. The proportion of income from subsistenceactivities is higher in Yap <strong>and</strong> Chuuk, showing that households in these states relied more on local food fortheir livelihood. Chuuk also have a higher proportion of its total income from imputed rent compared to theother states. This is largely due to most of its households being in the outer isl<strong>and</strong>s where all houses areowner-occupied.Division of Statistics,4 Office of Statistics, Budget & Economic Management, Overseas Development Assistance, <strong>and</strong> Compact Management


