

Household Income and Expenditure Survey Analysis Report
Household Income and Expenditure Survey Analysis Report
Household Income and Expenditure Survey Analysis Report

You also want an ePaper? Increase the reach of your titles
YUMPU automatically turns print PDFs into web optimized ePapers that Google loves.
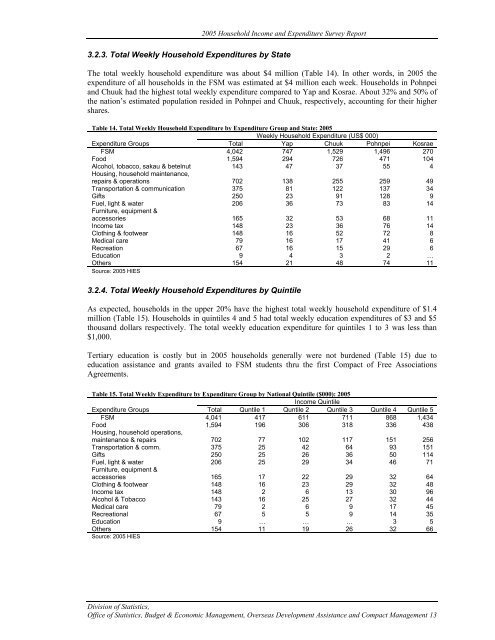
2005 <strong>Household</strong> <strong>Income</strong> <strong>and</strong> <strong>Expenditure</strong> <strong>Survey</strong> <strong>Report</strong>3.2.3. Total Weekly <strong>Household</strong> <strong>Expenditure</strong>s by StateThe total weekly household expenditure was about $4 million (Table 14). In other words, in 2005 theexpenditure of all households in the FSM was estimated at $4 million each week. <strong>Household</strong>s in Pohnpei<strong>and</strong> Chuuk had the highest total weekly expenditure compared to Yap <strong>and</strong> Kosrae. About 32% <strong>and</strong> 50% ofthe nation’s estimated population resided in Pohnpei <strong>and</strong> Chuuk, respectively, accounting for their highershares.Table 14. Total Weekly <strong>Household</strong> <strong>Expenditure</strong> by <strong>Expenditure</strong> Group <strong>and</strong> State: 2005Weekly <strong>Household</strong> <strong>Expenditure</strong> (US$ 000)<strong>Expenditure</strong> Groups Total Yap Chuuk Pohnpei KosraeFSM 4,042 747 1,529 1,496 270Food 1,594 294 726 471 104Alcohol, tobacco, sakau & betelnut 143 47 37 55 4Housing, household maintenance,repairs & operations 702 138 255 259 49Transportation & communication 375 81 122 137 34Gifts 250 23 91 128 9Fuel, light & water 206 36 73 83 14Furniture, equipment &accessories 165 32 53 68 11<strong>Income</strong> tax 148 23 36 76 14Clothing & footwear 148 16 52 72 8Medical care 79 16 17 41 6Recreation 67 16 15 29 6Education 9 4 3 2 …Others 154 21 48 74 11Source: 2005 HIES3.2.4. Total Weekly <strong>Household</strong> <strong>Expenditure</strong>s by QuintileAs expected, households in the upper 20% have the highest total weekly household expenditure of $1.4million (Table 15). <strong>Household</strong>s in quintiles 4 <strong>and</strong> 5 had total weekly education expenditures of $3 <strong>and</strong> $5thous<strong>and</strong> dollars respectively. The total weekly education expenditure for quintiles 1 to 3 was less than$1,000.Tertiary education is costly but in 2005 households generally were not burdened (Table 15) due toeducation assistance <strong>and</strong> grants availed to FSM students thru the first Compact of Free AssociationsAgreements.Table 15. Total Weekly <strong>Expenditure</strong> by <strong>Expenditure</strong> Group by National Quintile ($000): 2005<strong>Income</strong> Quintile<strong>Expenditure</strong> Groups Total Quntile 1 Quntile 2 Quntile 3 Quntile 4 Quntile 5FSM 4,041 417 611 711 868 1,434Food 1,594 196 306 318 336 438Housing, household operations,maintenance & repairs 702 77 102 117 151 256Transportation & comm. 375 25 42 64 93 151Gifts 250 25 26 36 50 114Fuel, light & water 206 25 29 34 46 71Furniture, equipment &accessories 165 17 22 29 32 64Clothing & footwear 148 16 23 29 32 48<strong>Income</strong> tax 148 2 6 13 30 96Alcohol & Tobacco 143 16 25 27 32 44Medical care 79 2 6 9 17 45Recreational 67 5 5 9 14 35Education 9 … … … 3 5Others 154 11 19 26 32 66Source: 2005 HIESDivision of Statistics,Office of Statistics, Budget & Economic Management, Overseas Development Assistance <strong>and</strong> Compact Management 13


