

Household Income and Expenditure Survey Analysis Report
Household Income and Expenditure Survey Analysis Report
Household Income and Expenditure Survey Analysis Report

Create successful ePaper yourself
Turn your PDF publications into a flip-book with our unique Google optimized e-Paper software.
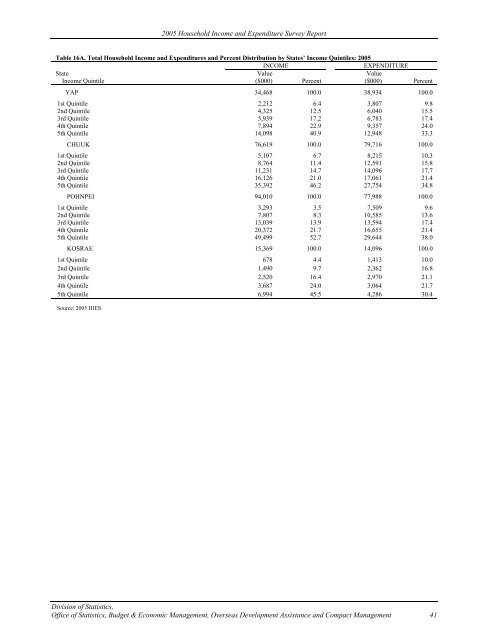
2005 <strong>Household</strong> <strong>Income</strong> <strong>and</strong> <strong>Expenditure</strong> <strong>Survey</strong> <strong>Report</strong>Table 16A. Total <strong>Household</strong> <strong>Income</strong> <strong>and</strong> <strong>Expenditure</strong>s <strong>and</strong> Percent Distribution by States’ <strong>Income</strong> Quintiles: 2005INCOMEEXPENDITUREState Value Value<strong>Income</strong> Quintile ($000) Percent ($000) PercentYAP 34,468 100.0 38,934 100.01st Quintile 2,212 6.4 3,807 9.82nd Quintile 4,325 12.5 6,040 15.53rd Quintile 5,939 17.2 6,783 17.44th Quintile 7,894 22.9 9,357 24.05th Quintile 14,098 40.9 12,948 33.3CHUUK 76,619 100.0 79,716 100.01st Quintile 5,107 6.7 8,215 10.32nd Quintile 8,764 11.4 12,591 15.83rd Quintile 11,231 14.7 14,096 17.74th Quintile 16,126 21.0 17,061 21.45th Quintile 35,392 46.2 27,754 34.8POHNPEI 94,010 100.0 77,988 100.01st Quintile 3,293 3.5 7,509 9.62nd Quintile 7,807 8.3 10,585 13.63rd Quintile 13,039 13.9 13,594 17.44th Quintile 20,372 21.7 16,655 21.45th Quintile 49,499 52.7 29,644 38.0KOSRAE 15,369 100.0 14,096 100.01st Quintile 678 4.4 1,413 10.02nd Quintile 1,490 9.7 2,362 16.83rd Quintile 2,520 16.4 2,970 21.14th Quintile 3,687 24.0 3,064 21.75th Quintile 6,994 45.5 4,286 30.4Source: 2005 HIESDivision of Statistics,Office of Statistics, Budget & Economic Management, Overseas Development Assistance <strong>and</strong> Compact Management 41


