

Household Income and Expenditure Survey Analysis Report
Household Income and Expenditure Survey Analysis Report
Household Income and Expenditure Survey Analysis Report

Create successful ePaper yourself
Turn your PDF publications into a flip-book with our unique Google optimized e-Paper software.
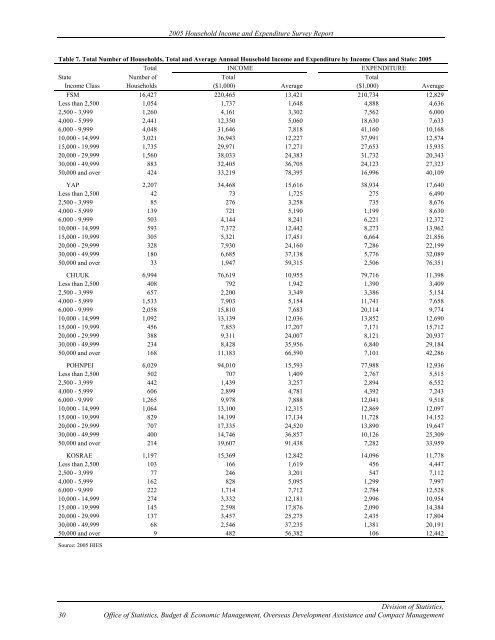
2005 <strong>Household</strong> <strong>Income</strong> <strong>and</strong> <strong>Expenditure</strong> <strong>Survey</strong> <strong>Report</strong>Table 7. Total Number of <strong>Household</strong>s, Total <strong>and</strong> Average Annual <strong>Household</strong> <strong>Income</strong> <strong>and</strong> <strong>Expenditure</strong> by <strong>Income</strong> Class <strong>and</strong> State: 2005Total INCOME EXPENDITUREState Number of Total Total<strong>Income</strong> Class <strong>Household</strong>s ($1,000) Average ($1,000) AverageFSM 16,427 220,465 13,421 210,734 12,829Less than 2,500 1,054 1,737 1,648 4,888 4,6362,500 - 3,999 1,260 4,161 3,302 7,562 6,0004,000 - 5,999 2,441 12,350 5,060 18,630 7,6336,000 - 9,999 4,048 31,646 7,818 41,160 10,16810,000 - 14,999 3,021 36,943 12,227 37,991 12,57415,000 - 19,999 1,735 29,971 17,271 27,653 15,93520,000 - 29,999 1,560 38,033 24,383 31,732 20,34330,000 - 49,999 883 32,405 36,705 24,123 27,32350,000 <strong>and</strong> over 424 33,219 78,395 16,996 40,109YAP 2,207 34,468 15,616 38,934 17,640Less than 2,500 42 73 1,725 275 6,4902,500 - 3,999 85 276 3,258 735 8,6764,000 - 5,999 139 721 5,190 1,199 8,6306,000 - 9,999 503 4,144 8,241 6,221 12,37210,000 - 14,999 593 7,372 12,442 8,273 13,96215,000 - 19,999 305 5,321 17,451 6,664 21,85620,000 - 29,999 328 7,930 24,160 7,286 22,19930,000 - 49,999 180 6,685 37,138 5,776 32,08950,000 <strong>and</strong> over 33 1,947 59,315 2,506 76,351CHUUK 6,994 76,619 10,955 79,716 11,398Less than 2,500 408 792 1,942 1,390 3,4092,500 - 3,999 657 2,200 3,349 3,386 5,1544,000 - 5,999 1,533 7,903 5,154 11,741 7,6586,000 - 9,999 2,058 15,810 7,683 20,114 9,77410,000 - 14,999 1,092 13,139 12,036 13,852 12,69015,000 - 19,999 456 7,853 17,207 7,171 15,71220,000 - 29,999 388 9,311 24,007 8,121 20,93730,000 - 49,999 234 8,428 35,956 6,840 29,18450,000 <strong>and</strong> over 168 11,183 66,590 7,101 42,286POHNPEI 6,029 94,010 15,593 77,988 12,936Less than 2,500 502 707 1,409 2,767 5,5152,500 - 3,999 442 1,439 3,257 2,894 6,5524,000 - 5,999 606 2,899 4,781 4,392 7,2436,000 - 9,999 1,265 9,978 7,888 12,041 9,51810,000 - 14,999 1,064 13,100 12,315 12,869 12,09715,000 - 19,999 829 14,199 17,134 11,728 14,15220,000 - 29,999 707 17,335 24,520 13,890 19,64730,000 - 49,999 400 14,746 36,857 10,126 25,30950,000 <strong>and</strong> over 214 19,607 91,438 7,282 33,959KOSRAE 1,197 15,369 12,842 14,096 11,778Less than 2,500 103 166 1,619 456 4,4472,500 - 3,999 77 246 3,201 547 7,1124,000 - 5,999 162 828 5,095 1,299 7,9976,000 - 9,999 222 1,714 7,712 2,784 12,52810,000 - 14,999 274 3,332 12,181 2,996 10,95415,000 - 19,999 145 2,598 17,876 2,090 14,38420,000 - 29,999 137 3,457 25,275 2,435 17,80430,000 - 49,999 68 2,546 37,235 1,381 20,19150,000 <strong>and</strong> over 9 482 56,382 106 12,442Source: 2005 HIESDivision of Statistics,30 Office of Statistics, Budget & Economic Management, Overseas Development Assistance <strong>and</strong> Compact Management


