

Household Income and Expenditure Survey Analysis Report
Household Income and Expenditure Survey Analysis Report
Household Income and Expenditure Survey Analysis Report

You also want an ePaper? Increase the reach of your titles
YUMPU automatically turns print PDFs into web optimized ePapers that Google loves.
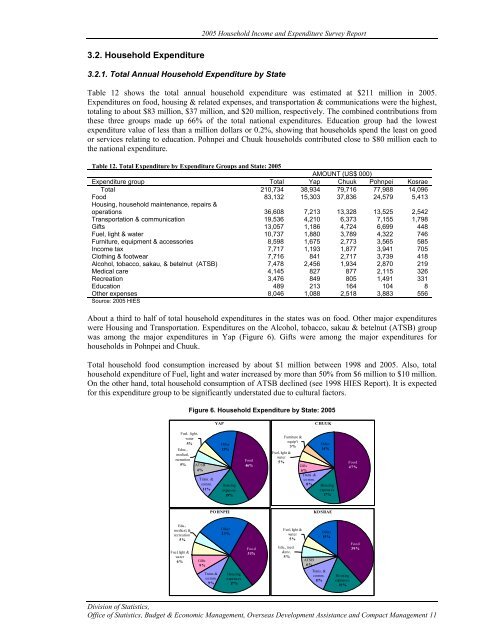
2005 <strong>Household</strong> <strong>Income</strong> <strong>and</strong> <strong>Expenditure</strong> <strong>Survey</strong> <strong>Report</strong>3.2. <strong>Household</strong> <strong>Expenditure</strong>3.2.1. Total Annual <strong>Household</strong> <strong>Expenditure</strong> by StateTable 12 shows the total annual household expenditure was estimated at $211 million in 2005.<strong>Expenditure</strong>s on food, housing & related expenses, <strong>and</strong> transportation & communications were the highest,totaling to about $83 million, $37 million, <strong>and</strong> $20 million, respectively. The combined contributions fromthese three groups made up 66% of the total national expenditures. Education group had the lowestexpenditure value of less than a million dollars or 0.2%, showing that households spend the least on goodor services relating to education. Pohnpei <strong>and</strong> Chuuk households contributed close to $80 million each tothe national expenditure.Table 12. Total <strong>Expenditure</strong> by <strong>Expenditure</strong> Groups <strong>and</strong> State: 2005AMOUNT (US$ 000)<strong>Expenditure</strong> group Total Yap Chuuk Pohnpei KosraeTotal 210,734 38,934 79,716 77,988 14,096Food 83,132 15,303 37,836 24,579 5,413Housing, household maintenance, repairs &operations 36,608 7,213 13,328 13,525 2,542Transportation & communication 19,536 4,210 6,373 7,155 1,798Gifts 13,057 1,186 4,724 6,699 448Fuel, light & water 10,737 1,880 3,789 4,322 746Furniture, equipment & accessories 8,598 1,675 2,773 3,565 585<strong>Income</strong> tax 7,717 1,193 1,877 3,941 705Clothing & footwear 7,716 841 2,717 3,739 418Alcohol, tobacco, sakau, & betelnut (ATSB) 7,478 2,456 1,934 2,870 219Medical care 4,145 827 877 2,115 326Recreation 3,476 849 805 1,491 331Education 489 213 164 104 8Other expenses 8,046 1,088 2,518 3,883 556Source: 2005 HIESAbout a third to half of total household expenditures in the states was on food. Other major expenditureswere Housing <strong>and</strong> Transportation. <strong>Expenditure</strong>s on the Alcohol, tobacco, sakau & betelnut (ATSB) groupwas among the major expenditures in Yap (Figure 6). Gifts were among the major expenditures forhouseholds in Pohnpei <strong>and</strong> Chuuk.Total household food consumption increased by about $1 million between 1998 <strong>and</strong> 2005. Also, totalhousehold expenditure of Fuel, light <strong>and</strong> water increased by more than 50% from $6 million to $10 million.On the other h<strong>and</strong>, total household consumption of ATSB declined (see 1998 HIES <strong>Report</strong>). It is expectedfor this expenditure group to be significantly understated due to cultural factors.Figure 6. <strong>Household</strong> <strong>Expenditure</strong> by State: 2005YAPCHUUKFuel, light,water5%Educ.,medical,recreation5%ATSB6%Trans. &comm.11%Other15%Housingexpenses19%Food46%Fuel, light &wa te r5%Furniture &equip't3%Gifts6%Trans. &comm.8%Other14 %Housingexpenses17 %Food47%POHNPEIKO SRAEEdu.,medical, &recreation5%Fuel, light &wa ter6%Gifts9%Trans.&comm.9%Other23%Housingexpenses17 %Food31%Fuel, light &wa ter5%Edu., med.& re c .5%ATSB6%Trans. &comm.11%Other15 %Housingexpenses19 %Food39%Division of Statistics,Office of Statistics, Budget & Economic Management, Overseas Development Assistance <strong>and</strong> Compact Management 11


