Global Purchasing Power Parities and Real Expenditures - Afristat
Global Purchasing Power Parities and Real Expenditures - Afristat
Global Purchasing Power Parities and Real Expenditures - Afristat
Create successful ePaper yourself
Turn your PDF publications into a flip-book with our unique Google optimized e-Paper software.
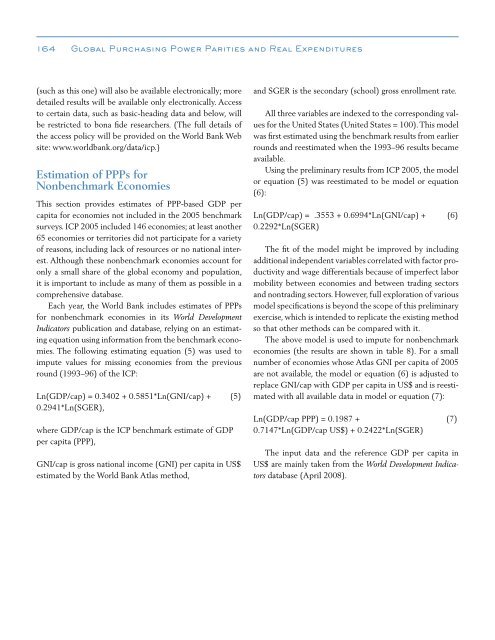
164 <strong>Global</strong> <strong>Purchasing</strong> <strong>Power</strong> <strong>Parities</strong> <strong>and</strong> <strong>Real</strong> <strong>Expenditures</strong>(such as this one) will also be available electronically; moredetailed results will be available only electronically. Accessto certain data, such as basic-heading data <strong>and</strong> below, willbe restricted to bona fide researchers. (The full details ofthe access policy will be provided on the World Bank Website: www.worldbank.org/data/icp.)Estimation of PPPs forNonbenchmark EconomiesThis section provides estimates of PPP-based GDP percapita for economies not included in the 2005 benchmarksurveys. ICP 2005 included 146 economies; at least another65 economies or territories did not participate for a varietyof reasons, including lack of resources or no national interest.Although these nonbenchmark economies account foronly a small share of the global economy <strong>and</strong> population,it is important to include as many of them as possible in acomprehensive database.Each year, the World Bank includes estimates of PPPsfor nonbenchmark economies in its World DevelopmentIndicators publication <strong>and</strong> database, relying on an estimatingequation using information from the benchmark economies.The following estimating equation (5) was used toimpute values for missing economies from the previousround (1993–96) of the ICP:Ln(GDP/cap) = 0.3402 + 0.5851*Ln(GNI/cap) + (5)0.2941*Ln(SGER),where GDP/cap is the ICP benchmark estimate of GDPper capita (PPP),GNI/cap is gross national income (GNI) per capita in US$estimated by the World Bank Atlas method,<strong>and</strong> SGER is the secondary (school) gross enrollment rate.All three variables are indexed to the corresponding valuesfor the United States (United States = 100). This modelwas first estimated using the benchmark results from earlierrounds <strong>and</strong> reestimated when the 1993–96 results becameavailable.Using the preliminary results from ICP 2005, the modelor equation (5) was reestimated to be model or equation(6):Ln(GDP/cap) = .3553 + 0.6994*Ln(GNI/cap) + (6)0.2292*Ln(SGER)The fit of the model might be improved by includingadditional independent variables correlated with factor productivity<strong>and</strong> wage differentials because of imperfect labormobility between economies <strong>and</strong> between trading sectors<strong>and</strong> nontrading sectors. However, full exploration of variousmodel specifications is beyond the scope of this preliminaryexercise, which is intended to replicate the existing methodso that other methods can be compared with it.The above model is used to impute for nonbenchmarkeconomies (the results are shown in table 8). For a smallnumber of economies whose Atlas GNI per capita of 2005are not available, the model or equation (6) is adjusted toreplace GNI/cap with GDP per capita in US$ <strong>and</strong> is reestimatedwith all available data in model or equation (7):Ln(GDP/cap PPP) = 0.1987 + (7)0.7147*Ln(GDP/cap US$) + 0.2422*Ln(SGER)The input data <strong>and</strong> the reference GDP per capita inUS$ are mainly taken from the World Development Indicatorsdatabase (April 2008).


