

Global Purchasing Power Parities and Real Expenditures - Afristat
Global Purchasing Power Parities and Real Expenditures - Afristat
Global Purchasing Power Parities and Real Expenditures - Afristat

You also want an ePaper? Increase the reach of your titles
YUMPU automatically turns print PDFs into web optimized ePapers that Google loves.
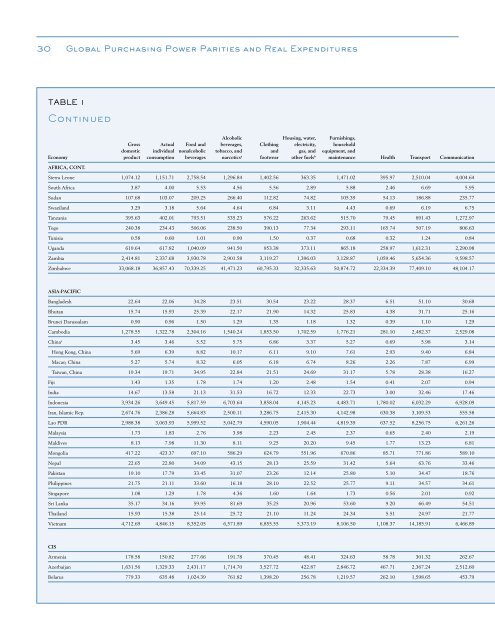
30 <strong>Global</strong> <strong>Purchasing</strong> <strong>Power</strong> <strong>Parities</strong> <strong>and</strong> <strong>Real</strong> <strong>Expenditures</strong>TABLE 1ContinuedAlcoholic Housing, water, Furnishings,Gross Actual Food <strong>and</strong> beverages, Clothing electricity, householddomestic individual nonalcoholic tobacco, <strong>and</strong> <strong>and</strong> gas, <strong>and</strong> equipment, <strong>and</strong>Economy product consumption beverages narcotics a footwear other fuels b maintenance Health Transport CommunicationAfrica, CONT.Sierra Leone 1,074.12 1,151.71 2,758.54 1,296.84 1,402.56 363.35 1,471.02 395.97 2,510.04 4,004.64South Africa 3.87 4.00 5.53 4.56 5.56 2.89 5.88 2.46 6.69 5.95Sudan 107.68 103.07 209.25 266.40 112.82 74.82 105.39 54.13 186.88 235.77Swazil<strong>and</strong> 3.29 3.18 5.64 4.64 6.84 3.11 4.43 0.69 6.19 6.75Tanzania 395.63 402.01 793.51 535.23 576.22 263.62 515.70 79.45 891.43 1,272.97Togo 240.38 234.43 506.06 238.50 390.13 77.34 293.11 165.74 507.19 806.63Tunisia 0.58 0.60 1.01 0.90 1.50 0.37 0.68 0.32 1.24 0.84Ug<strong>and</strong>a 619.64 617.82 1,040.09 941.50 953.38 373.11 865.18 258.97 1,612.31 2,290.98Zambia 2,414.81 2,337.68 3,930.78 2,901.58 3,119.27 1,396.03 3,128.87 1,059.46 5,654.36 9,598.57Zimbabwe 33,068.18 36,857.43 70,339.25 41,471.23 60,795.33 32,335.63 50,874.72 22,334.39 77,409.10 48,104.17Asia-PacificBangladesh 22.64 22.06 34.28 23.51 30.54 23.22 28.37 6.51 51.10 30.68Bhutan 15.74 15.93 25.39 22.17 21.90 14.32 25.83 4.38 31.71 25.16Brunei Darussalam 0.90 0.96 1.50 1.29 1.35 1.18 1.32 0.39 1.10 1.29Cambodia 1,278.55 1,322.78 2,304.16 1,540.24 1,853.50 1,702.59 1,776.21 281.10 2,482.37 2,529.08China e 3.45 3.46 5.52 5.75 6.86 3.37 5.27 0.69 5.98 3.14Hong Kong, China 5.69 6.39 8.82 10.17 6.11 9.10 7.61 2.93 9.40 6.84Macao, China 5.27 5.74 8.32 6.05 6.18 6.74 8.26 2.26 7.87 6.99Taiwan, China 19.34 19.71 34.95 22.84 21.51 24.69 31.17 5.78 28.38 16.27Fiji 1.43 1.35 1.78 1.74 1.20 2.48 1.54 0.41 2.07 0.94India 14.67 13.58 21.13 31.53 16.72 12.33 22.73 3.00 32.46 17.46Indonesia 3,934.26 3,649.45 5,817.59 6,703.64 3,858.04 4,145.23 4,483.71 1,780.02 6,032.29 6,928.09Iran, Islamic Rep. 2,674.76 2,386.28 5,664.83 2,500.11 3,286.75 2,415.30 4,142.98 630.38 3,109.53 555.58Lao PDR 2,988.38 3,063.93 5,999.52 5,042.79 4,590.05 1,904.44 4,819.39 637.52 8,256.75 6,261.26Malaysia 1.73 1.83 2.76 3.98 2.23 2.45 2.37 0.65 2.40 2.19Maldives 8.13 7.98 11.30 8.11 9.25 20.20 9.45 1.77 13.23 6.81Mongolia 417.22 423.37 697.10 586.29 624.79 551.96 670.86 85.71 771.86 589.10Nepal 22.65 22.80 34.09 43.15 28.13 25.59 31.42 5.64 63.76 33.46Pakistan 19.10 17.79 33.45 31.07 23.26 12.14 25.80 5.10 34.47 18.76Philippines 21.75 21.11 33.60 16.18 28.10 22.52 25.77 9.11 34.57 34.61Singapore 1.08 1.29 1.78 4.36 1.60 1.64 1.73 0.56 2.01 0.92Sri Lanka 35.17 34.16 59.95 81.69 35.25 20.96 53.60 9.20 66.49 54.51Thail<strong>and</strong> 15.93 15.38 25.14 25.72 21.10 11.24 24.34 5.51 24.97 21.77Vietnam 4,712.69 4,846.15 8,352.05 6,571.89 6,855.55 5,373.19 8,106.50 1,108.37 14,185.91 6,466.89CISArmenia 178.58 150.82 277.66 191.78 370.45 48.41 324.63 58.78 301.32 262.67Azerbaijan 1,631.56 1,329.33 2,431.17 1,714.70 3,527.72 422.87 2,846.72 467.71 2,367.24 2,512.60Belarus 779.33 635.48 1,024.39 761.82 1,398.20 256.78 1,219.57 262.10 1,598.65 453.79


