- Page 2: Global Purchasing PowerParities and
- Page 5 and 6: © 2008 by the International Bank f
- Page 7 and 8: viContentsPart II: Technical Notes
- Page 10 and 11: Acronyms and AbbreviationsADBAfDBBO
- Page 12 and 13: PrefaceThis publication presents th
- Page 14 and 15: AcknowledgmentsThe ICP shares a com
- Page 16: Part IPurchasing Power Paritiesand
- Page 19 and 20: Global Purchasing Power Parities an
- Page 21 and 22: Global Purchasing Power Parities an
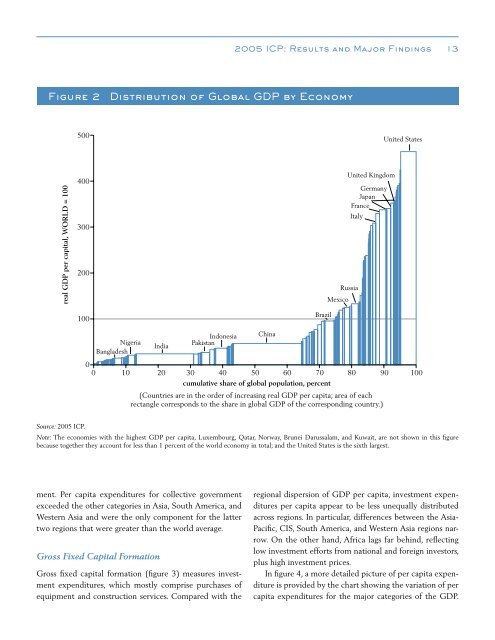
- Page 24 and 25: 2005 ICP:Results and Major Findings
- Page 26 and 27: 2005 ICP: Results and Major Finding
- Page 30 and 31: 2005 ICP: Results and Major Finding
- Page 32 and 33: 2005 ICP: Results and Major Finding
- Page 34 and 35: 2005 ICP: Results and Major Finding
- Page 36: Tables of Results21
- Page 39 and 40: 24 Global Purchasing Power Parities
- Page 41 and 42: 26 Global Purchasing Power Parities
- Page 43 and 44: 28 Global Purchasing Power Parities
- Page 45 and 46: 30 Global Purchasing Power Parities
- Page 47 and 48: 32 Global Purchasing Power Parities
- Page 49 and 50: 34 Global Purchasing Power Parities
- Page 51 and 52: 36 Global Purchasing Power Parities
- Page 53 and 54: 38 Global Purchasing Power Parities
- Page 55 and 56: 40 Global Purchasing Power Parities
- Page 57 and 58: 42 Global Purchasing Power Parities
- Page 59 and 60: 44 Global Purchasing Power Parities
- Page 61 and 62: 46 Global Purchasing Power Parities
- Page 63 and 64: 48 Global Purchasing Power Parities
- Page 65 and 66: 50 Global Purchasing Power Parities
- Page 67 and 68: 52 Global Purchasing Power Parities
- Page 69 and 70: 54 Global Purchasing Power Parities
- Page 71 and 72: 56 Global Purchasing Power Parities
- Page 73 and 74: 58 Global Purchasing Power Parities
- Page 75 and 76: 60 Global Purchasing Power Parities
- Page 77 and 78: 62 Global Purchasing Power Parities
- Page 79 and 80:
64 Global Purchasing Power Parities
- Page 81 and 82:
66 Global Purchasing Power Parities
- Page 83 and 84:
68 Global Purchasing Power Parities
- Page 85 and 86:
70 Global Purchasing Power Parities
- Page 87 and 88:
72 Global Purchasing Power Parities
- Page 89 and 90:
74 Global Purchasing Power Parities
- Page 91 and 92:
76 Global Purchasing Power Parities
- Page 93 and 94:
78 Global Purchasing Power Parities
- Page 95 and 96:
80 Global Purchasing Power Parities
- Page 97 and 98:
82 Global Purchasing Power Parities
- Page 99 and 100:
84 Global Purchasing Power Parities
- Page 101 and 102:
86 Global Purchasing Power Parities
- Page 103 and 104:
88 Global Purchasing Power Parities
- Page 105 and 106:
90 Global Purchasing Power Parities
- Page 107 and 108:
92 Global Purchasing Power Parities
- Page 109 and 110:
94 Global Purchasing Power Parities
- Page 111 and 112:
96 Global Purchasing Power Parities
- Page 113 and 114:
98 Global Purchasing Power Parities
- Page 115 and 116:
100 Global Purchasing Power Paritie
- Page 117 and 118:
102 Global Purchasing Power Paritie
- Page 119 and 120:
104 Global Purchasing Power Paritie
- Page 121 and 122:
106 Global Purchasing Power Paritie
- Page 123 and 124:
108 Global Purchasing Power Paritie
- Page 125 and 126:
110 Global Purchasing Power Paritie
- Page 127 and 128:
112 Global Purchasing Power Paritie
- Page 129 and 130:
114 Global Purchasing Power Paritie
- Page 131 and 132:
116 Global Purchasing Power Paritie
- Page 133 and 134:
118 Global Purchasing Power Paritie
- Page 135 and 136:
120 Global Purchasing Power Paritie
- Page 137 and 138:
122 Global Purchasing Power Paritie
- Page 139 and 140:
124 Global Purchasing Power Paritie
- Page 141 and 142:
126 Global Purchasing Power Paritie
- Page 143 and 144:
128 Global Purchasing Power Paritie
- Page 145 and 146:
130 Global Purchasing Power Paritie
- Page 147 and 148:
132 Global Purchasing Power Paritie
- Page 149 and 150:
134 Global Purchasing Power Paritie
- Page 151 and 152:
136 Global Purchasing Power Paritie
- Page 154:
Part IITechnical Notes of the 2005
- Page 157 and 158:
142 Global Purchasing Power Paritie
- Page 159 and 160:
144 Global Purchasing Power Paritie
- Page 162 and 163:
Comparison-Resistant AreasSome comp
- Page 164 and 165:
Comparison-Resistant Areas 149mmmHo
- Page 166 and 167:
Data ValidationData validation was
- Page 168:
Data Validation 153determines the l
- Page 171 and 172:
156 Global Purchasing Power Paritie
- Page 173 and 174:
158 Global Purchasing Power Paritie
- Page 175 and 176:
160 Global Purchasing Power Paritie
- Page 177 and 178:
162 Global Purchasing Power Paritie
- Page 179 and 180:
164 Global Purchasing Power Paritie
- Page 182 and 183:
Appendix AHistory of The ICPEconomi
- Page 184:
Appendix A 169which selected econom
- Page 187 and 188:
172 Global Purchasing Power Paritie
- Page 189 and 190:
174 Global Purchasing Power Paritie
- Page 191 and 192:
176 Global Purchasing Power Paritie
- Page 193 and 194:
178 Global Purchasing Power Paritie
- Page 195 and 196:
180 Global Purchasing Power Paritie
- Page 197 and 198:
182 Global Purchasing Power Paritie
- Page 199 and 200:
184 Global Purchasing Power Paritie
- Page 201 and 202:
186 Global Purchasing Power Paritie
- Page 203 and 204:
188 Global Purchasing Power Paritie
- Page 205 and 206:
190 Global Purchasing Power Paritie
- Page 207 and 208:
192 Global Purchasing Power Paritie
- Page 209 and 210:
194 Global Purchasing Power Paritie
- Page 211 and 212:
196 Global Purchasing Power Paritie
- Page 213 and 214:
198 Global Purchasing Power Paritie
- Page 216 and 217:
GlossaryActual individual consumpti
- Page 218 and 219:
Glossary 203tice, general administr
- Page 220 and 221:
Glossary 205in nonmarket production
- Page 222 and 223:
Glossary 207Multilateral comparison
- Page 224:
Glossary 209able as a result of the
- Page 227 and 228:
212 Global Purchasing Power Paritie