

Global Purchasing Power Parities and Real Expenditures - Afristat
Global Purchasing Power Parities and Real Expenditures - Afristat
Global Purchasing Power Parities and Real Expenditures - Afristat

You also want an ePaper? Increase the reach of your titles
YUMPU automatically turns print PDFs into web optimized ePapers that Google loves.
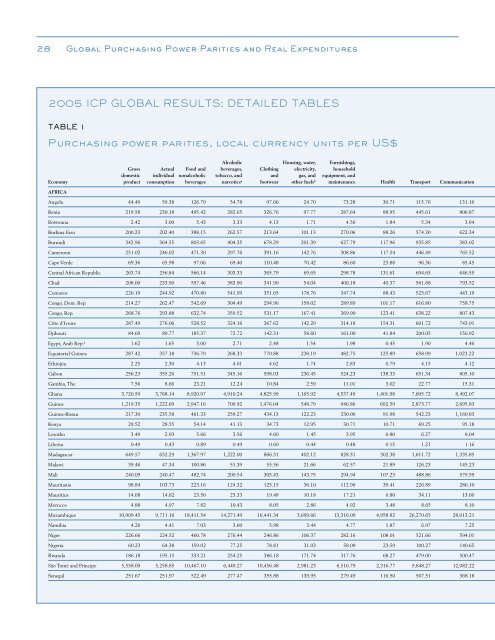
28 <strong>Global</strong> <strong>Purchasing</strong> <strong>Power</strong> <strong>Parities</strong> <strong>and</strong> <strong>Real</strong> <strong>Expenditures</strong>2005 ICP GLOBAL RESULTS: DETAILED TABLESTABLE 1<strong>Purchasing</strong> power parities, local currency units per US$Alcoholic Housing, water, Furnishings,Gross Actual Food <strong>and</strong> beverages, Clothing electricity, householddomestic individual nonalcoholic tobacco, <strong>and</strong> <strong>and</strong> gas, <strong>and</strong> equipment, <strong>and</strong>Economy product consumption beverages narcotics a footwear other fuels b maintenance Health Transport CommunicationAfricaAngola 44.49 59.38 126.79 54.78 97.66 24.70 73.28 30.71 115.76 131.16Benin 219.58 230.18 495.42 282.65 326.76 97.77 287.64 88.95 445.61 806.87Botswana 2.42 3.00 5.43 3.33 4.13 1.71 4.56 1.84 5.34 3.94Burkina Faso 200.23 202.40 388.15 262.57 213.64 101.13 270.06 88.26 574.30 622.34Burundi 342.96 364.55 803.65 404.35 678.29 201.39 627.79 117.96 935.85 383.02Cameroon 251.02 246.02 471.30 297.76 391.16 142.76 308.86 117.54 446.49 765.52Cape Verde 69.36 65.98 97.06 69.40 110.48 70.42 86.60 23.88 96.36 85.45Central African Republic 263.74 256.84 566.14 303.33 365.79 69.65 298.78 131.61 694.65 646.55Chad 208.00 233.90 597.46 383.90 341.90 54.04 400.18 40.37 561.68 793.52Comoros 226.19 244.92 470.80 541.99 351.65 178.76 347.74 88.43 523.67 443.19Congo, Dem. Rep. 214.27 262.47 542.69 304.49 294.96 158.02 289.89 101.17 616.80 758.75Congo, Rep. 268.76 293.88 632.74 359.52 531.17 167.41 369.90 123.41 638.22 807.43Côte d’Ivoire 287.49 276.06 528.52 324.16 367.62 142.29 314.18 154.31 601.72 743.91Djibouti 84.69 89.77 185.37 72.72 142.31 58.60 161.00 41.84 200.05 156.92Egypt, Arab Rep. d 1.62 1.65 3.00 2.71 2.48 1.54 1.98 0.45 1.90 4.46Equatorial Guinea 287.42 357.18 736.79 268.33 770.88 238.19 482.75 125.89 658.99 1,023.22Ethiopia 2.25 2.30 4.13 4.01 4.62 1.74 2.83 0.79 4.15 4.12Gabon 256.23 355.26 751.51 345.16 598.03 236.45 524.23 138.33 651.34 805.10Gambia, The 7.56 8.66 23.21 12.24 10.84 2.59 11.01 3.02 22.77 15.31Ghana 3,720.59 3,768.14 8,920.97 4,910.24 4,825.99 1,165.92 4,537.49 1,401.98 7,605.72 8,492.07Guinea 1,219.35 1,222.69 2,947.16 709.92 1,476.04 548.79 946.86 692.59 2,873.77 2,695.83Guinea-Bissau 217.30 235.58 461.33 259.27 434.13 122.23 330.06 91.98 542.23 1,160.83Kenya 29.52 28.55 54.14 41.13 34.73 12.95 30.71 10.71 69.25 95.18Lesotho 3.49 2.93 5.66 3.56 4.60 1.45 3.95 0.80 6.27 8.04Liberia 0.49 0.43 0.89 0.49 0.60 0.44 0.48 0.15 1.21 1.16Madagascar 649.57 632.29 1,367.97 1,222.00 866.31 402.12 828.31 302.38 1,611.72 1,335.85Malawi 39.46 47.34 100.86 51.39 55.56 21.66 62.57 21.89 126.23 145.23Mali 240.09 240.47 482.74 200.54 305.43 143.75 294.94 107.23 488.86 579.59Mauritania 98.84 103.73 223.16 124.32 125.15 36.10 112.96 39.41 226.89 286.10Mauritius 14.68 14.62 23.50 23.33 19.48 10.18 17.21 6.80 34.11 13.60Morocco 4.88 4.97 7.82 10.43 8.05 2.86 4.92 3.48 8.65 8.10Mozambique 10,909.45 9,711.16 18,411.54 14,271.49 16,441.34 3,699.66 13,316.09 4,958.82 26,270.65 28,013.21Namibia 4.26 4.41 7.03 3.60 5.98 3.44 4.77 1.87 6.97 7.25Niger 226.66 224.52 460.78 276.44 246.86 106.37 282.16 108.01 521.66 594.01Nigeria 60.23 64.38 159.02 77.25 78.81 31.03 58.09 23.59 100.27 140.65Rw<strong>and</strong>a 186.18 195.15 333.21 254.25 386.18 171.74 317.76 68.27 479.00 500.47São Tomé <strong>and</strong> Principe 5,558.09 5,258.85 10,467.10 6,449.27 10,456.48 2,981.23 6,516.79 2,316.77 9,848.27 12,082.22Senegal 251.67 251.97 522.49 277.47 355.88 139.95 279.49 116.50 507.51 368.18


