

Global Purchasing Power Parities and Real Expenditures - Afristat
Global Purchasing Power Parities and Real Expenditures - Afristat
Global Purchasing Power Parities and Real Expenditures - Afristat

You also want an ePaper? Increase the reach of your titles
YUMPU automatically turns print PDFs into web optimized ePapers that Google loves.
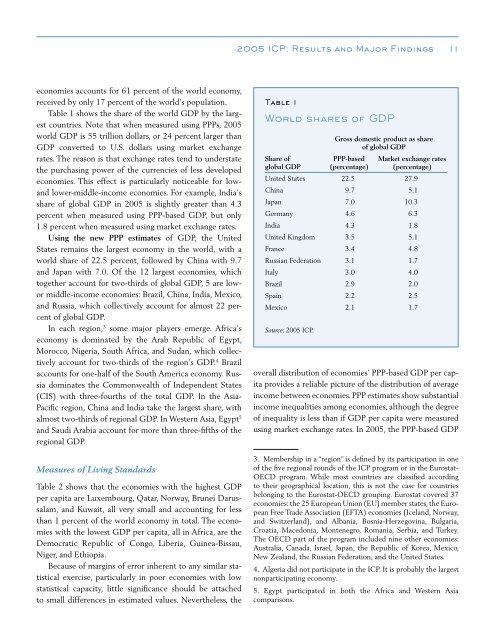
2005 ICP: Results <strong>and</strong> Major Findings 11economies accounts for 61 percent of the world economy,received by only 17 percent of the world’s population.Table 1 shows the share of the world GDP by the largestcountries. Note that when measured using PPPs, 2005world GDP is 55 trillion dollars, or 24 percent larger thanGDP converted to U.S. dollars using market exchangerates. The reason is that exchange rates tend to understatethe purchasing power of the currencies of less developedeconomies. This effect is particularly noticeable for low<strong>and</strong>lower-middle-income economies. For example, India’sshare of global GDP in 2005 is slightly greater than 4.3percent when measured using PPP-based GDP, but only1.8 percent when measured using market exchange rates.Using the new PPP estimates of GDP, the UnitedStates remains the largest economy in the world, with aworld share of 22.5 percent, followed by China with 9.7<strong>and</strong> Japan with 7.0. Of the 12 largest economies, whichtogether account for two-thirds of global GDP, 5 are lowormiddle-income economies: Brazil, China, India, Mexico,<strong>and</strong> Russia, which collectively account for almost 22 percentof global GDP.In each region, 3 some major players emerge. Africa’seconomy is dominated by the Arab Republic of Egypt,Morocco, Nigeria, South Africa, <strong>and</strong> Sudan, which collectivelyaccount for two-thirds of the region’s GDP. 4 Brazilaccounts for one-half of the South America economy. Russiadominates the Commonwealth of Independent States(CIS) with three-fourths of the total GDP. In the Asia-Pacific region, China <strong>and</strong> India take the largest share, withalmost two-thirds of regional GDP. In Western Asia, Egypt 5<strong>and</strong> Saudi Arabia account for more than three-fifths of theregional GDP.Measures of Living St<strong>and</strong>ardsTable 2 shows that the economies with the highest GDPper capita are Luxembourg, Qatar, Norway, Brunei Darussalam,<strong>and</strong> Kuwait, all very small <strong>and</strong> accounting for lessthan 1 percent of the world economy in total. The economieswith the lowest GDP per capita, all in Africa, are theDemocratic Republic of Congo, Liberia, Guinea-Bissau,Niger, <strong>and</strong> Ethiopia.Because of margins of error inherent to any similar statisticalexercise, particularly in poor economies with lowstatistical capacity, little significance should be attachedto small differences in estimated values. Nevertheless, theTable 1World shares of GDPGross domestic product as shareof global GDPShare of PPP-based Market exchange ratesglobal GDP (percentage) (percentage)United States 22.5 27.9China 9.7 5.1Japan 7.0 10.3Germany 4.6 6.3India 4.3 1.8United Kingdom 3.5 5.1France 3.4 4.8Russian Federation 3.1 1.7Italy 3.0 4.0Brazil 2.9 2.0Spain 2.2 2.5Mexico 2.1 1.7Source: 2005 ICP.overall distribution of economies’ PPP-based GDP per capitaprovides a reliable picture of the distribution of averageincome between economies. PPP estimates show substantialincome inequalities among economies, although the degreeof inequality is less than if GDP per capita were measuredusing market exchange rates. In 2005, the PPP-based GDP3. Membership in a “region” is defined by its participation in oneof the five regional rounds of the ICP program or in the Eurostat-OECD program. While most countries are classified accordingto their geographical location, this is not the case for countriesbelonging to the Eurostat-OECD grouping. Eurostat covered 37economies: the 25 European Union (EU) member states, the EuropeanFree Trade Association (EFTA) economies (Icel<strong>and</strong>, Norway,<strong>and</strong> Switzerl<strong>and</strong>), <strong>and</strong> Albania, Bosnia-Herzegovina, Bulgaria,Croatia, Macedonia, Montenegro, Romania, Serbia, <strong>and</strong> Turkey.The OECD part of the program included nine other economies:Australia, Canada, Israel, Japan, the Republic of Korea, Mexico,New Zeal<strong>and</strong>, the Russian Federation, <strong>and</strong> the United States.4. Algeria did not participate in the ICP. It is probably the largestnonparticipating economy.5. Egypt participated in both the Africa <strong>and</strong> Western Asiacomparisons.


