TABLE B–70.—Components of money stock measures and liquid assets, 1959–98—Continued[Averages of daily figures; billions of dollars, seasonally adjusted, except as noted]YearandmonthLargedenominationtimedeposits 3Overnightand termrepurchaseagreements(RPs)(net)Overnightand termEurodollars(net)Savingsbonds 4ShorttermTreasurysecurities4Bankersacceptances4Commercialpaper 4December:1959 ............................................................................. 1.2 0.0 0.7 46.1 38.6 0.6 3.61960 ............................................................................. 2.0 .0 .8 45.7 36.7 .9 5.11961 ............................................................................. 3.9 .0 1.5 46.5 37.0 1.1 5.21962 ............................................................................. 7.0 .0 1.6 46.9 39.8 1.1 6.81963 ............................................................................. 10.8 .0 1.9 48.1 40.7 1.2 7.71964 ............................................................................. 15.2 .0 2.4 49.0 38.5 1.3 9.11965 ............................................................................. 21.2 .0 1.8 49.6 40.7 1.6 10.21966 ............................................................................. 23.1 .0 2.2 50.2 43.2 1.8 14.41967 ............................................................................. 30.9 .0 2.2 51.2 38.7 1.8 17.81968 ............................................................................. 37.4 .0 2.9 51.8 46.1 2.3 22.51969 ............................................................................. 20.4 4.9 2.7 51.7 59.5 3.3 34.01970 ............................................................................. 45.1 3.0 2.4 52.0 49.0 3.5 33.21971 ............................................................................. 57.6 5.2 2.9 54.3 36.1 3.8 32.31972 ............................................................................. 73.3 6.6 3.9 57.6 40.8 3.5 35.11973 ............................................................................. 111.0 12.8 5.8 60.4 49.4 5.0 41.61974 ............................................................................. 144.7 14.2 8.5 63.3 52.8 12.6 49.71975 ............................................................................. 129.7 14.7 10.2 67.2 68.5 10.7 48.11976 ............................................................................. 118.1 25.1 15.4 71.8 69.9 10.8 52.21977 ............................................................................. 145.2 32.9 21.9 76.4 78.4 14.1 64.11978 ............................................................................. 195.6 44.6 35.1 80.3 81.4 22.0 80.91979 ............................................................................. 223.1 47.7 49.8 79.5 108.2 27.1 99.71980 ............................................................................. 260.2 57.4 57.7 72.3 133.9 32.0 99.51981 ............................................................................. 303.9 65.3 77.0 67.8 149.4 39.9 103.81982 ............................................................................. 324.9 67.4 89.8 68.0 182.9 44.5 108.31983 ............................................................................. 316.5 94.5 104.8 71.1 213.2 45.0 136.51984 ............................................................................. 403.2 105.4 96.9 74.2 261.9 45.4 157.31985 ............................................................................. 422.4 119.9 94.0 79.5 298.2 42.1 208.91986 ............................................................................. 420.2 143.3 103.9 91.8 275.8 37.1 231.21987 ............................................................................. 467.0 172.6 108.2 100.6 249.5 44.5 272.71988 ............................................................................. 518.3 189.0 117.0 109.4 266.8 40.2 334.31989 ............................................................................. 541.5 158.0 95.2 117.5 324.0 40.7 344.61990 ............................................................................. 481.0 138.8 88.7 126.0 334.1 36.2 354.41991 ............................................................................. 416.6 119.5 79.3 137.9 328.8 23.9 335.21992 ............................................................................. 353.5 128.6 66.9 156.6 344.7 21.0 365.71993 ............................................................................. 333.6 158.8 66.3 171.5 340.8 14.9 387.11994 ............................................................................. 363.4 183.3 80.8 180.2 382.9 14.1 405.01995 ............................................................................. 419.6 182.4 88.6 184.7 469.2 11.4 441.31996 ............................................................................. 491.2 194.2 109.2 186.9 454.8 12.4 498.51997 ............................................................................. 572.9 236.1 145.3 186.4 429.6 12.1 606.31998 p .......................................................................... 624.4 283.4 150.7 ................ ................ ................ ................1997: Jan .......................................................................... 496.6 197.2 112.3 186.7 442.8 12.2 510.5Feb ......................................................................... 505.5 200.0 114.7 186.6 444.5 12.8 518.7Mar ......................................................................... 516.8 198.6 116.8 186.5 446.3 13.3 526.1Apr .......................................................................... 528.8 202.4 120.7 186.4 451.2 12.8 534.5May ........................................................................ 531.0 204.1 126.7 186.3 458.6 13.0 541.1June ........................................................................ 538.6 199.8 124.5 186.4 450.8 12.8 553.2July ......................................................................... 550.5 207.4 126.6 186.4 433.5 12.7 563.6Aug ......................................................................... 552.4 210.3 130.2 186.4 445.3 13.0 563.2Sept ........................................................................ 559.7 209.8 132.4 186.4 445.0 12.9 563.9Oct .......................................................................... 560.8 219.5 131.8 186.4 435.2 13.4 571.3Nov ......................................................................... 567.3 233.9 135.7 186.4 441.5 13.0 581.3Dec ......................................................................... 572.9 236.1 145.3 186.4 429.6 12.1 606.31998: Jan .......................................................................... 577.5 246.9 146.5 186.3 434.4 12.2 627.1Feb ......................................................................... 592.8 241.7 140.3 186.3 455.1 11.2 640.2Mar ......................................................................... 611.6 259.7 133.8 186.2 438.4 11.3 665.7Apr .......................................................................... 610.7 259.7 134.3 186.1 410.7 13.0 674.2May ........................................................................ 615.8 261.4 138.3 186.0 407.8 13.3 665.5June ........................................................................ 623.9 254.3 139.9 186.0 396.6 13.4 686.2July ......................................................................... 610.4 258.3 143.5 186.0 371.2 14.6 701.6Aug ......................................................................... 616.4 265.5 148.3 185.9 374.3 14.8 697.7Sept ........................................................................ 616.1 272.1 149.4 186.0 371.2 14.0 715.0Oct .......................................................................... 614.6 267.5 152.8 ................ ................ ................ ................Nov ......................................................................... 621.4 277.8 153.6 ................ ................ ................ ................Dec p ....................................................................... 624.4 283.4 150.7 ................ ................ ................ ................3Large denomination deposits are those issued in amounts of more than $100,000.4See footnote 1, Table B–69.Note.—See also Table B–69.Source: Board of Governors of the Federal Reserve System.409
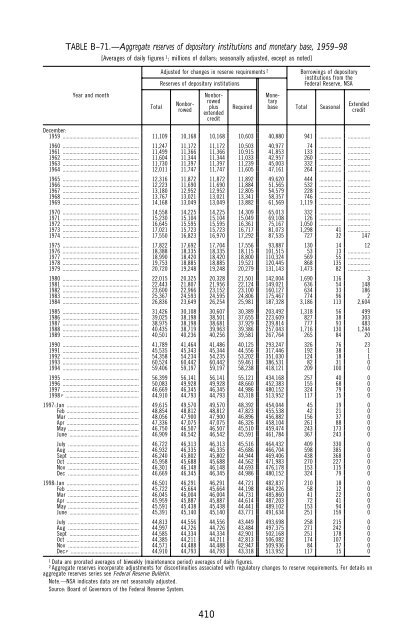
TABLE B–71.—Aggregate reserves of depository institutions and monetary base, 1959–98[Averages of daily figures 1 ; millions of dollars; seasonally adjusted, except as noted]Year and monthTotalAdjusted for changes in reserve requirements 2Reserves of depository institutionsNonborrowedNonborrowedplusextendedcreditRequiredBorrowings of depositoryinstitutions from theFederal Reserve, NSAMonetarybase Total SeasonalExtendedcreditDecember:1959 ....................................................... 11,109 10,168 10,168 10,603 40,880 941 ................ ................1960 ....................................................... 11,247 11,172 11,172 10,503 40,977 74 ................ ................1961 ....................................................... 11,499 11,366 11,366 10,915 41,853 133 ................ ................1962 ....................................................... 11,604 11,344 11,344 11,033 42,957 260 ................ ................1963 ....................................................... 11,730 11,397 11,397 11,239 45,003 332 ................ ................1964 ....................................................... 12,011 11,747 11,747 11,605 47,161 264 ................ ................1965 ....................................................... 12,316 11,872 11,872 11,892 49,620 444 ................ ................1966 ....................................................... 12,223 11,690 11,690 11,884 51,565 532 ................ ................1967 ....................................................... 13,180 12,952 12,952 12,805 54,579 228 ................ ................1968 ....................................................... 13,767 13,021 13,021 13,341 58,357 746 ................ ................1969 ....................................................... 14,168 13,049 13,049 13,882 61,569 1,119 ................ ................1970 ....................................................... 14,558 14,225 14,225 14,309 65,013 332 ................ ................1971 ....................................................... 15,230 15,104 15,104 15,049 69,108 126 ................ ................1972 ....................................................... 16,645 15,595 15,595 16,361 75,167 1,050 ................ ................1973 ....................................................... 17,021 15,723 15,723 16,717 81,073 1,298 41 ................1974 ....................................................... 17,550 16,823 16,970 17,292 87,535 727 32 1471975 ....................................................... 17,822 17,692 17,704 17,556 93,887 130 14 121976 ....................................................... 18,388 18,335 18,335 18,115 101,515 53 13 ................1977 ....................................................... 18,990 18,420 18,420 18,800 110,324 569 55 ................1978 ....................................................... 19,753 18,885 18,885 19,521 120,445 868 135 ................1979 ....................................................... 20,720 19,248 19,248 20,279 131,143 1,473 82 ................1980 ....................................................... 22,015 20,325 20,328 21,501 142,004 1,690 116 31981 ....................................................... 22,443 21,807 21,956 22,124 149,021 636 54 1481982 ....................................................... 23,600 22,966 23,152 23,100 160,127 634 33 1861983 ....................................................... 25,367 24,593 24,595 24,806 175,467 774 96 21984 ....................................................... 26,836 23,649 26,254 25,981 187,328 3,186 113 2,6041985 ....................................................... 31,426 30,108 30,607 30,389 203,492 1,318 56 4991986 ....................................................... 39,025 38,198 38,501 37,655 223,609 827 38 3031987 ....................................................... 38,975 38,198 38,681 37,929 239,814 777 93 4831988 ....................................................... 40,435 38,719 39,963 39,386 257,043 1,716 130 1,2441989 ....................................................... 40,501 40,236 40,256 39,581 267,764 265 84 201990 ....................................................... 41,789 41,464 41,486 40,125 293,247 326 76 231991 ....................................................... 45,535 45,343 45,344 44,556 317,446 192 38 11992 ....................................................... 54,358 54,234 54,235 53,202 351,030 124 18 11993 ....................................................... 60,524 60,442 60,442 59,461 386,531 82 31 01994 ....................................................... 59,406 59,197 59,197 58,238 418,121 209 100 01995 ....................................................... 56,399 56,141 56,141 55,121 434,168 257 40 01996 ....................................................... 50,083 49,928 49,928 48,660 452,383 155 68 01997 ....................................................... 46,669 46,345 46,345 44,986 480,152 324 79 01998 p ..................................................... 44,910 44,793 44,793 43,318 513,952 117 15 01997: Jan .................................................... 49,615 49,570 49,570 48,392 454,044 45 19 0Feb .................................................... 48,854 48,812 48,812 47,823 455,538 42 21 0Mar ................................................... 48,056 47,900 47,900 46,896 456,882 156 37 0Apr .................................................... 47,336 47,075 47,075 46,326 458,104 261 88 0May ................................................... 46,750 46,507 46,507 45,510 459,474 243 173 0June .................................................. 46,909 46,542 46,542 45,591 461,784 367 243 0July ................................................... 46,722 46,313 46,313 45,516 464,432 409 330 0Aug ................................................... 46,932 46,335 46,335 45,686 466,704 598 385 0Sept .................................................. 46,240 45,802 45,802 44,944 469,406 438 368 0Oct .................................................... 45,958 45,688 45,688 44,562 471,983 270 227 0Nov ................................................... 46,301 46,148 46,148 44,693 476,178 153 115 0Dec ................................................... 46,669 46,345 46,345 44,986 480,152 324 79 01998: Jan .................................................... 46,501 46,291 46,291 44,721 482,837 210 18 0Feb .................................................... 45,722 45,664 45,664 44,198 484,226 58 12 0Mar ................................................... 46,045 46,004 46,004 44,731 485,860 41 22 0Apr .................................................... 45,959 45,887 45,887 44,614 487,203 72 41 0May ................................................... 45,591 45,438 45,438 44,441 489,102 153 94 0June .................................................. 45,391 45,140 45,140 43,771 491,634 251 159 0July ................................................... 44,813 44,556 44,556 43,449 493,698 258 215 0Aug ................................................... 44,997 44,726 44,726 43,484 497,375 271 242 0Sept .................................................. 44,585 44,334 44,334 42,901 502,168 251 178 0Oct .................................................... 44,385 44,211 44,211 42,813 506,082 174 107 0Nov ................................................... 44,571 44,488 44,488 42,947 509,936 84 37 0Dec p ................................................. 44,910 44,793 44,793 43,318 513,952 117 15 01Data are prorated averages of biweekly (maintenance period) averages of daily figures.2Aggregate reserves incorporate adjustments for discontinuities associated with regulatory changes to reserve requirements. For details onaggregate reserves series see Federal Reserve Bulletin.Note.—NSA indicates data are not seasonally adjusted.Source: Board of Governors of the Federal Reserve System.410
- Page 1 and 2:
EconomicReportof thePresidentTransm
- Page 3 and 4:
C O N T E N T SPageECONOMIC REPORT
- Page 5 and 6:
ECONOMIC REPORT OF THE PRESIDENTTo
- Page 7 and 8:
Once we have saved Social Security,
- Page 9 and 10:
THE ANNUAL REPORTOF THECOUNCIL OF E
- Page 11 and 12:
C O N T E N T SPageCHAPTER 1. MEETI
- Page 13 and 14:
PageCHAPTER 5. REGULATION AND INNOV
- Page 15 and 16:
Page2-3. Accounting for Growth in R
- Page 17 and 18:
Page6-5. Terms of Trade ...........
- Page 19 and 20:
CHAPTER 1Meeting Challenges and Bui
- Page 21 and 22:
Box 1-1.—The Dating of Business C
- Page 23 and 24:
Chart 1-1 Core Inflation and Unempl
- Page 25 and 26:
expansion prematurely. In fact, the
- Page 27 and 28:
the duration of the typical unemplo
- Page 29 and 30:
throughout that decade of peace and
- Page 31 and 32:
all individuals aged 65 and older r
- Page 33 and 34:
extent that it would reduce Social
- Page 35 and 36:
the vulnerability of the internatio
- Page 37 and 38:
access. Even so, international agre
- Page 39 and 40:
eliminated entirely, because the go
- Page 41 and 42:
Nevertheless, adjustment assistance
- Page 43 and 44:
CHAPTER 2Macroeconomic Policyand Pe
- Page 45 and 46:
Then the chapter explores two other
- Page 47 and 48:
target Federal funds rate brought t
- Page 49 and 50:
high of 66.8 percent in the third q
- Page 51 and 52:
the third-quarter deceleration and
- Page 53 and 54:
(that is, excluding food and energy
- Page 55 and 56:
probably would have increased by ab
- Page 57 and 58:
Equities clearly involve risk as we
- Page 59 and 60:
highest level in at least 40 years
- Page 61 and 62:
attributed to the lesser liquidity
- Page 63 and 64:
971231 980106 980112 980116 980122
- Page 65 and 66:
about the potential impact of large
- Page 67 and 68:
With respect to leverage, the degre
- Page 69 and 70:
noted earlier, investment-grade bor
- Page 71 and 72:
Chart 2-8 Corporate Profits and Net
- Page 73 and 74:
is attributable to the strong econo
- Page 75 and 76:
productivity; the latter is in turn
- Page 77 and 78:
the year 2000, mistaking it instead
- Page 79:
Box 2-2.—continuedare not expecte
- Page 82 and 83:
construct an accurate forecasting m
- Page 84 and 85:
is estimated as the location where
- Page 86 and 87:
the recent surge in productivity re
- Page 88 and 89:
Box 2-3.—continuedhowever. Import
- Page 90 and 91:
Chart 2-12 Three Measures of Core I
- Page 92 and 93:
a level of capacity utilization tha
- Page 94 and 95:
Box 2-4.—continuedChanges to be i
- Page 96 and 97:
Nonfarm manufacturing and trade inv
- Page 98 and 99:
has been for the past 3 years. But
- Page 100 and 101:
who have traditionally not fared as
- Page 102 and 103:
Box 3-1.—continuedas well as full
- Page 104 and 105:
and been replaced by younger, more
- Page 106 and 107:
Particularly interesting, however,
- Page 108 and 109:
Chart 3-5 Median Hourly Wages of Me
- Page 110 and 111:
In fact, in 1990 immigrants and nat
- Page 112 and 113:
Box 3-2.—continuedsome firms may
- Page 114 and 115:
Box 3-3.—continuedmaximum of $3,7
- Page 116 and 117:
willing to hire welfare recipients
- Page 118 and 119:
participation. The renewed increase
- Page 120 and 121:
TANF grants in reserve at the Treas
- Page 122 and 123:
JOB DISPLACEMENTWorkers are conside
- Page 124 and 125:
evidence finds that the percentage
- Page 126 and 127:
their non-labor market activities.
- Page 128 and 129:
The Administration is especially co
- Page 130 and 131:
CHAPTER 4Work, Retirement, and theE
- Page 132 and 133:
Chart 4-1 Life Expectancy at Age 65
- Page 134 and 135:
Population aging is not just an Ame
- Page 136 and 137:
Box 4-1.—continuedfor couples and
- Page 138 and 139:
earlier retirement, by increasing l
- Page 140 and 141:
uyouts may also have contributed to
- Page 142 and 143:
Box 4-2.—Social Security RulesThe
- Page 144 and 145:
available with the same hourly pay,
- Page 146 and 147:
Box 4-4.—Types of Pension PlansUn
- Page 148 and 149:
worker—declined. More of these ol
- Page 150 and 151:
survey) was about 13 percent higher
- Page 152 and 153:
well-being is that families have di
- Page 154 and 155:
Chart 4-9 Living Arrangements of El
- Page 156 and 157:
mentioned earlier in this chapter a
- Page 158 and 159:
Box 4-7.—The Federal Role in Empl
- Page 160 and 161:
inequality among retirees who have
- Page 162 and 163:
whether minorities and women are li
- Page 164 and 165:
TABLE 4-4.—Poverty Rates Among th
- Page 166 and 167:
TABLE 4-6.—Family Holdings of Fin
- Page 168 and 169:
variety of reasons, including the f
- Page 170 and 171:
the number of patents granted in th
- Page 172 and 173:
The United States has a decades-lon
- Page 174 and 175:
matter, depending on various condit
- Page 176 and 177:
company Roche Holdings, Ltd. Some o
- Page 178 and 179:
The antitrust authorities’ linkin
- Page 180 and 181:
espective Writings and Discoveries.
- Page 182 and 183:
Box 5-3.—Cooperative Innovation a
- Page 184 and 185:
machine owned by another. The disti
- Page 186 and 187:
companies begin to offer DSL servic
- Page 188 and 189:
and compete for customers on the ba
- Page 190 and 191:
In another part of the Internet mar
- Page 192 and 193:
technology at hand. But incentive-b
- Page 194 and 195:
the flexibility to choose lower cos
- Page 196 and 197:
In contrast to both performance and
- Page 198 and 199:
The SO 2 experience reveals several
- Page 200 and 201:
Box 5-7.—The Partnership for a Ne
- Page 202 and 203:
Consumers’ investment in energy e
- Page 204 and 205:
clean-energy projects in developing
- Page 206 and 207:
Chart 5-2 Energy Efficiency and Pri
- Page 208 and 209:
equipment, and more than 90 percent
- Page 210 and 211:
Box 5-9.—Is There an Environmenta
- Page 212 and 213:
larger coal plants. In 1994 these t
- Page 214 and 215:
around the country, and seven other
- Page 216 and 217:
other social goals. The fund would
- Page 218 and 219:
greater opportunity, faster growth,
- Page 220 and 221:
Chart 6-1 Net Capital Flows to Deve
- Page 222 and 223:
Box 6-1.—The Explosive Growth of
- Page 224 and 225:
Recent Financial LiberalizationIn m
- Page 226 and 227:
and investment (although openness t
- Page 228 and 229:
Box 6-2.—Market-Based (Arm’s-Le
- Page 230 and 231:
conditionality in the face of unsou
- Page 232 and 233:
Box 6-4.—Sovereign Spreads in Eme
- Page 234 and 235:
social safety nets in the crisis co
- Page 236 and 237:
Box 6-5.—Moral Hazard in Financia
- Page 238 and 239:
Empirical studies confirm that, by
- Page 240 and 241:
withdrew $26 billion in 1997. Altho
- Page 242 and 243:
America, and these linkages partly
- Page 244 and 245:
8.5 percent of GDP in 1998. Indones
- Page 246 and 247:
sary revenues to meet these extra i
- Page 248 and 249:
which is considered a monetary asse
- Page 250 and 251:
ates at home, they sought higher re
- Page 252 and 253:
Chart 6-3 Real Value of the Dollar
- Page 254 and 255:
The increase in the trade deficit a
- Page 256 and 257:
Chart 6-6 Current Account BalanceTh
- Page 258 and 259:
Chart 6-7 Economic Growth and Trade
- Page 260 and 261:
investment. The U.S. gross investme
- Page 262 and 263:
Chart 6-10 Current Account Deficit
- Page 264 and 265:
with other countries to strengthen
- Page 266 and 267:
REFORM OF THE INTERNATIONAL FINANCI
- Page 268 and 269:
about their macroeconomic and finan
- Page 270 and 271:
decisions respond to market signals
- Page 272 and 273:
Other measures recommended by the w
- Page 274 and 275:
ADOPTION OF MEASURES TO REFORM THEI
- Page 276 and 277:
Another way to improve global surve
- Page 278 and 279:
Issues Posed by Hedge Funds and Oth
- Page 280 and 281:
the best investment opportunities,
- Page 282 and 283:
egulation of inflows to banks alone
- Page 284 and 285:
complement the role of official fin
- Page 286 and 287:
emerging markets will take time to
- Page 288 and 289:
Box 7-1.—continuedpartner; a stro
- Page 290 and 291:
Chart 7-1 European Short-Term Inter
- Page 292 and 293:
members agreed in a separate Growth
- Page 294 and 295:
Box 7-2.—continuedthrough an auto
- Page 296 and 297:
advantages of EMU to U.S. residents
- Page 298 and 299:
Box 7-3.—How Does the Dollar Rank
- Page 300 and 301:
connection between the currency in
- Page 302 and 303:
as an economic superpower early in
- Page 304 and 305:
Appendix AREPORT TO THE PRESIDENT O
- Page 306 and 307:
Council Members and Their Dates of
- Page 308 and 309:
The Chair and Members work as a tea
- Page 310 and 311:
countries. The Council heads the U.
- Page 312 and 313:
Chief of Staff and General CounselM
- Page 314 and 315:
affiliations. They are Christopher
- Page 316 and 317:
C O N T E N T SNATIONAL INCOME OR E
- Page 318 and 319:
B-71. Aggregate reserves of deposit
- Page 320 and 321:
General NotesDetail in these tables
- Page 322 and 323:
TABLE B-1.—Gross domestic product
- Page 324 and 325:
TABLE B-2.—Real gross domestic pr
- Page 326 and 327:
TABLE B-4.—Percent changes in rea
- Page 328 and 329:
TABLE B-5.—Contributions to perce
- Page 330 and 331:
TABLE B-6.—Chain-type quantity in
- Page 332 and 333:
TABLE B-7.—Chain-type price index
- Page 334 and 335:
TABLE B-9.—Real gross domestic pr
- Page 336 and 337:
Year orquarterGrossdomesticproductT
- Page 338 and 339:
YearBased on1972 SIC:TABLE B-13.—
- Page 340 and 341:
TABLE B-15.—Output, costs, and pr
- Page 342 and 343:
TABLE B-17.—Real personal consump
- Page 344 and 345:
TABLE B-19.—Real private gross fi
- Page 346 and 347:
TABLE B-21.—Real government consu
- Page 348 and 349:
TABLE B-23.—Real inventories and
- Page 350 and 351:
TABLE B-25.—Real exports and impo
- Page 352 and 353:
TABLE B-27.—Relation of national
- Page 354 and 355: TABLE B-28.—National income by ty
- Page 356 and 357: TABLE B-29.—Sources of personal i
- Page 358 and 359: TABLE B-31.—Total and per capita
- Page 360 and 361: TABLE B-32.—Gross saving and inve
- Page 362 and 363: POPULATION, EMPLOYMENT, WAGES, AND
- Page 364 and 365: TABLE B-35.—Civilian population a
- Page 366 and 367: TABLE B-37.—Civilian employment b
- Page 368 and 369: TABLE B-39.—Civilian labor force
- Page 370 and 371: TABLE B-41.—Civilian employment/p
- Page 372 and 373: TABLE B-43.—Civilian unemployment
- Page 374 and 375: TABLE B-45.—Unemployment insuranc
- Page 376 and 377: TABLE B-46.—Employees on nonagric
- Page 378 and 379: TABLE B-48.—Employment cost index
- Page 380 and 381: Year orquarterTABLE B-50.—Changes
- Page 382 and 383: Year or monthTABLE B-52.—Industri
- Page 384 and 385: TABLE B-54.—Capacity utilization
- Page 386 and 387: Year or monthTABLE B-56.—New hous
- Page 388 and 389: TABLE B-58.—Manufacturers’ ship
- Page 390 and 391: PRICESTABLE B-60.—Consumer price
- Page 392 and 393: TABLE B-61.—Consumer price indexe
- Page 394 and 395: TABLE B-63.—Changes in special co
- Page 396 and 397: TABLE B-65.—Producer price indexe
- Page 398 and 399: TABLE B-66.—Producer price indexe
- Page 400 and 401: TABLE B-67.—Producer price indexe
- Page 402 and 403: YearandmonthMONEY STOCK, CREDIT, AN
- Page 406 and 407: TABLE B-72.—Bank credit at all co
- Page 408 and 409: TABLE B-73.—Bond yields and inter
- Page 410 and 411: TABLE B-74.—Credit market borrowi
- Page 412 and 413: TABLE B-76.—Mortgage debt outstan
- Page 414 and 415: GOVERNMENT FINANCETABLE B-78.—Fed
- Page 416 and 417: TABLE B-80.—Federal receipts and
- Page 418 and 419: TABLE B-82.—Federal Government re
- Page 420 and 421: TABLE B-84.—Federal and State and
- Page 422 and 423: TABLE B-86.—State and local gover
- Page 424 and 425: TABLE B-88.—Maturity distribution
- Page 426 and 427: CORPORATE PROFITS AND FINANCETABLE
- Page 428 and 429: TABLE B-92.—Corporate profits of
- Page 430 and 431: TABLE B-94.—Relation of profits a
- Page 432 and 433: Year or monthTABLE B-96.—Business
- Page 434 and 435: End of yearTotalassetsTABLE B-98.
- Page 436 and 437: YearFarm population,April 1Number(t
- Page 438 and 439: YearTABLE B-102.—U.S. exports and
- Page 440 and 441: TABLE B-103.—U.S. international t
- Page 442 and 443: TABLE B-105.—U.S. international t
- Page 444 and 445: TABLE B-107.—International invest
- Page 446 and 447: TABLE B-109.—Civilian unemploymen
- Page 448 and 449: TABLE B-111.—International reserv