

Economic Report President
Economic Report of the President - The American Presidency Project
Economic Report of the President - The American Presidency Project
- No tags were found...

Create successful ePaper yourself
Turn your PDF publications into a flip-book with our unique Google optimized e-Paper software.
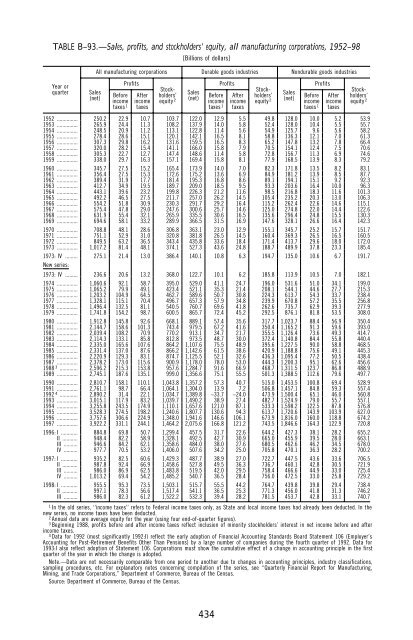
TABLE B–93.—Sales, profits, and stockholders’ equity, all manufacturing corporations, 1952–98Year orquarterSales(net)[Billions of dollars]All manufacturing corporations Durable goods industries Nondurable goods industriesBeforeincometaxes 1ProfitsAfterincometaxesStockholders’equity 2Sales(net)Beforeincometaxes 1ProfitsAfterincometaxesStockholders’equity 2Sales(net)Beforeincometaxes 1ProfitsAfterincometaxesStockholders’equity 21952 ............... 250.2 22.9 10.7 103.7 122.0 12.9 5.5 49.8 128.0 10.0 5.2 53.91953 ............... 265.9 24.4 11.3 108.2 137.9 14.0 5.8 52.4 128.0 10.4 5.5 55.71954 ............... 248.5 20.9 11.2 113.1 122.8 11.4 5.6 54.9 125.7 9.6 5.6 58.21955 ............... 278.4 28.6 15.1 120.1 142.1 16.5 8.1 58.8 136.3 12.1 7.0 61.31956 ............... 307.3 29.8 16.2 131.6 159.5 16.5 8.3 65.2 147.8 13.2 7.8 66.41957 ............... 320.0 28.2 15.4 141.1 166.0 15.8 7.9 70.5 154.1 12.4 7.5 70.61958 ............... 305.3 22.7 12.7 147.4 148.6 11.4 5.8 72.8 156.7 11.3 6.9 74.61959 ............... 338.0 29.7 16.3 157.1 169.4 15.8 8.1 77.9 168.5 13.9 8.3 79.21960 ............... 345.7 27.5 15.2 165.4 173.9 14.0 7.0 82.3 171.8 13.5 8.2 83.11961 ............... 356.4 27.5 15.3 172.6 175.2 13.6 6.9 84.9 181.2 13.9 8.5 87.71962 ............... 389.4 31.9 17.7 181.4 195.3 16.8 8.6 89.1 194.1 15.1 9.2 92.31963 ............... 412.7 34.9 19.5 189.7 209.0 18.5 9.5 93.3 203.6 16.4 10.0 96.31964 ............... 443.1 39.6 23.2 199.8 226.3 21.2 11.6 98.5 216.8 18.3 11.6 101.31965 ............... 492.2 46.5 27.5 211.7 257.0 26.2 14.5 105.4 235.2 20.3 13.0 106.31966 ............... 554.2 51.8 30.9 230.3 291.7 29.2 16.4 115.2 262.4 22.6 14.6 115.11967 ............... 575.4 47.8 29.0 247.6 300.6 25.7 14.6 125.0 274.8 22.0 14.4 122.61968 ............... 631.9 55.4 32.1 265.9 335.5 30.6 16.5 135.6 296.4 24.8 15.5 130.31969 ............... 694.6 58.1 33.2 289.9 366.5 31.5 16.9 147.6 328.1 26.6 16.4 142.31970 ............... 708.8 48.1 28.6 306.8 363.1 23.0 12.9 155.1 345.7 25.2 15.7 151.71971 ............... 751.1 52.9 31.0 320.8 381.8 26.5 14.5 160.4 369.3 26.5 16.5 160.51972 ............... 849.5 63.2 36.5 343.4 435.8 33.6 18.4 171.4 413.7 29.6 18.0 172.01973 ............... 1,017.2 81.4 48.1 374.1 527.3 43.6 24.8 188.7 489.9 37.8 23.3 185.41973: IV ......... 275.1 21.4 13.0 386.4 140.1 10.8 6.3 194.7 135.0 10.6 6.7 191.7New series:1973: IV ......... 236.6 20.6 13.2 368.0 122.7 10.1 6.2 185.8 113.9 10.5 7.0 182.11974 ............... 1,060.6 92.1 58.7 395.0 529.0 41.1 24.7 196.0 531.6 51.0 34.1 199.01975 ............... 1,065.2 79.9 49.1 423.4 521.1 35.3 21.4 208.1 544.1 44.6 27.7 215.31976 ............... 1,203.2 104.9 64.5 462.7 589.6 50.7 30.8 224.3 613.7 54.3 33.7 238.41977 ............... 1,328.1 115.1 70.4 496.7 657.3 57.9 34.8 239.9 670.8 57.2 35.5 256.81978 ............... 1,496.4 132.5 81.1 540.5 760.7 69.6 41.8 262.6 735.7 62.9 39.3 277.91979 ............... 1,741.8 154.2 98.7 600.5 865.7 72.4 45.2 292.5 876.1 81.8 53.5 308.01980 ............... 1,912.8 145.8 92.6 668.1 889.1 57.4 35.6 317.7 1,023.7 88.4 56.9 350.41981 ............... 2,144.7 158.6 101.3 743.4 979.5 67.2 41.6 350.4 1,165.2 91.3 59.6 393.01982 ............... 2,039.4 108.2 70.9 770.2 913.1 34.7 21.7 355.5 1,126.4 73.6 49.3 414.71983 ............... 2,114.3 133.1 85.8 812.8 973.5 48.7 30.0 372.4 1,140.8 84.4 55.8 440.41984 ............... 2,335.0 165.6 107.6 864.2 1,107.6 75.5 48.9 395.6 1,227.5 90.0 58.8 468.51985 ............... 2,331.4 137.0 87.6 866.2 1,142.6 61.5 38.6 420.9 1,188.8 75.6 49.1 445.31986 ............... 2,220.9 129.3 83.1 874.7 1,125.5 52.1 32.6 436.3 1,095.4 77.2 50.5 438.41987 ............... 2,378.2 173.0 115.6 900.9 1,178.0 78.0 53.0 444.3 1,200.3 95.1 62.6 456.61988 3 ............. 2,596.2 215.3 153.8 957.6 1,284.7 91.6 66.9 468.7 1,311.5 123.7 86.8 488.91989 ............... 2,745.1 187.6 135.1 999.0 1,356.6 75.1 55.5 501.3 1,388.5 112.6 79.6 497.71990 ............... 2,810.7 158.1 110.1 1,043.8 1,357.2 57.3 40.7 515.0 1,453.5 100.8 69.4 528.91991 ............... 2,761.1 98.7 66.4 1,064.1 1,304.0 13.9 7.2 506.8 1,457.1 84.8 59.3 557.41992 4 ............. 2,890.2 31.4 22.1 1,034.7 1,389.8 −33.7 −24.0 473.9 1,500.4 65.1 46.0 560.81993 ............... 3,015.1 117.9 83.2 1,039.7 1,490.2 38.9 27.4 482.7 1,524.9 79.0 55.7 557.11994 ............... 3,255.8 243.5 174.9 1,110.1 1,657.6 121.0 87.1 533.3 1,598.2 122.5 87.8 576.81995 ............... 3,528.3 274.5 198.2 1,240.6 1,807.7 130.6 94.3 613.7 1,720.6 143.9 103.9 627.01996 ............... 3,757.6 306.6 224.9 1,348.0 1,941.6 146.6 106.1 673.9 1,816.0 160.0 118.8 674.21997 ............... 3,922.2 331.1 244.1 1,464.2 2,075.6 166.8 121.2 743.5 1,846.6 164.3 122.9 720.81996: I ............ 884.8 69.8 50.7 1,299.4 457.5 31.7 22.6 644.2 427.3 38.1 28.2 655.2II ........... 948.4 82.2 58.9 1,328.1 492.5 42.7 30.9 665.0 455.9 39.5 28.0 663.1III .......... 946.6 84.2 62.1 1,358.6 484.0 38.0 27.6 680.5 462.6 46.2 34.5 678.0IV .......... 977.7 70.5 53.2 1,406.0 507.6 34.2 25.0 705.8 470.1 36.3 28.2 700.21997: I ............ 935.2 82.5 60.6 1,429.3 487.7 38.9 27.0 722.7 447.5 43.6 33.6 706.5II ........... 987.8 92.4 66.9 1,458.6 527.8 49.5 36.3 736.7 460.1 42.8 30.5 721.9III .......... 986.0 86.9 62.5 1,483.8 519.5 42.0 29.5 758.4 466.6 44.9 33.0 725.4IV .......... 1,013.2 69.4 54.2 1,485.2 540.7 36.5 28.4 756.0 472.5 33.0 25.8 729.21998: I ............ 955.5 95.3 73.5 1,503.1 515.7 55.5 44.2 764.7 439.8 39.8 29.4 738.4II ........... 997.1 78.3 56.6 1,517.4 541.1 36.5 25.3 771.3 456.0 41.8 31.3 746.2III .......... 986.0 82.3 61.2 1,522.2 532.3 39.4 28.2 781.5 453.7 42.8 33.1 740.71In the old series, ‘‘income taxes’’ refers to Federal income taxes only, as State and local income taxes had already been deducted. In thenew series, no income taxes have been deducted.2Annual data are average equity for the year (using four end-of-quarter figures).3Beginning 1988, profits before and after income taxes reflect inclusion of minority stockholders’ interest in net income before and afterincome taxes.4Data for 1992 (most significantly 1992:I) reflect the early adoption of Financial Accounting Standards Board Statement 106 (Employer’sAccounting for Post-Retirement Benefits Other Than Pensions) by a large number of companies during the fourth quarter of 1992. Data for1993:I also reflect adoption of Statement 106. Corporations must show the cumulative effect of a change in accounting principle in the firstquarter of the year in which the change is adopted.Note.—Data are not necessarily comparable from one period to another due to changes in accounting principles, industry classifications,sampling procedures, etc. For explanatory notes concerning compilation of the series, see ‘‘Quarterly Financial <strong>Report</strong> for Manufacturing,Mining, and Trade Corporations,’’ Department of Commerce, Bureau of the Census.Source: Department of Commerce, Bureau of the Census.434


