

Economic Report President
Economic Report of the President - The American Presidency Project
Economic Report of the President - The American Presidency Project
- No tags were found...

You also want an ePaper? Increase the reach of your titles
YUMPU automatically turns print PDFs into web optimized ePapers that Google loves.
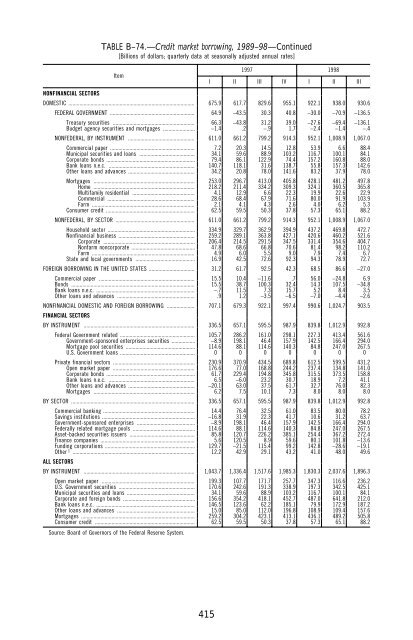
TABLE B–74.—Credit market borrowing, 1989–98—Continued[Billions of dollars; quarterly data at seasonally adjusted annual rates]1997 1998ItemI II III IV I II IIINONFINANCIAL SECTORSDOMESTIC ........................................................................................... 675.9 617.7 829.6 955.1 922.1 938.0 930.6FEDERAL GOVERNMENT ............................................................. 64.9 −43.5 30.3 40.8 −30.0 −70.9 −136.5Treasury securities ........................................................... 66.3 −43.8 31.2 39.0 −27.6 −69.4 −136.1Budget agency securities and mortgages ....................... −1.4 .2 −.9 1.7 −2.4 −1.4 −.4NONFEDERAL, BY INSTRUMENT ................................................ 611.0 661.2 799.2 914.3 952.1 1,008.9 1,067.0Commercial paper ............................................................. 7.2 20.3 14.5 12.8 53.9 6.6 88.4Municipal securities and loans ........................................ 34.1 59.6 88.9 103.2 116.7 100.1 84.1Corporate bonds ................................................................ 79.4 86.1 122.9 74.4 157.2 160.8 88.0Bank loans n.e.c. .............................................................. 140.7 118.1 31.6 138.7 55.8 157.3 142.6Other loans and advances ................................................ 34.2 20.8 78.0 141.6 83.2 37.9 78.0Mortgages ......................................................................... 253.0 296.7 413.0 405.8 428.1 481.2 497.8Home ......................................................................... 218.2 211.4 334.2 309.3 324.1 360.5 365.8Multifamily residential ............................................. 4.1 12.9 6.6 22.3 19.9 22.6 22.9Commercial ............................................................... 28.6 68.4 67.9 71.6 80.0 91.9 103.9Farm .......................................................................... 2.1 4.1 4.3 2.6 4.0 6.2 5.3Consumer credit ................................................................ 62.5 59.5 50.3 37.8 57.3 65.1 88.2NONFEDERAL, BY SECTOR ......................................................... 611.0 661.2 799.2 914.3 952.1 1,008.9 1,067.0Household sector ............................................................... 334.9 329.7 362.9 394.9 437.2 469.8 472.7Nonfinancial business ....................................................... 259.2 289.1 363.8 427.1 420.6 460.2 521.6Corporate .................................................................. 206.4 214.5 291.5 347.5 331.4 354.6 404.7Nonfarm noncorporate .............................................. 47.8 68.6 66.8 70.6 81.4 98.2 110.2Farm .......................................................................... 4.9 6.0 5.5 9.0 7.9 7.4 6.7State and local governments ........................................... 16.9 42.5 72.6 92.3 94.3 78.9 72.7FOREIGN BORROWING IN THE UNITED STATES ................................. 31.2 61.7 92.5 42.3 68.5 86.6 −27.0Commercial paper ..................................................................... 15.5 10.4 −11.6 .7 56.0 −24.8 6.9Bonds ......................................................................................... 15.5 38.7 100.3 32.4 14.3 107.5 −34.8Bank loans n.e.c. ....................................................................... −.7 11.5 7.3 15.7 5.2 8.4 3.5Other loans and advances ........................................................ .9 1.2 −3.5 −6.5 −7.0 −4.4 −2.6NONFINANCIAL DOMESTIC AND FOREIGN BORROWING .................... 707.1 679.3 922.1 997.4 990.6 1,024.7 903.5FINANCIAL SECTORSBY INSTRUMENT ................................................................................ 336.5 657.1 595.5 987.9 839.8 1,012.9 992.8Federal Government related ...................................................... 105.7 286.2 161.0 298.1 227.3 413.4 561.6Government-sponsored enterprises securities ................. −8.9 198.1 46.4 157.9 142.5 166.4 294.0Mortgage pool securities .................................................. 114.6 88.1 114.6 140.3 84.8 247.0 267.5U.S. Government loans ...................................................... 0 0 0 0 0 0 0Private financial sectors ........................................................... 230.9 370.9 434.5 689.8 612.5 599.5 431.2Open market paper ........................................................... 176.6 77.0 168.8 244.2 237.4 134.8 141.0Corporate bonds ................................................................ 61.7 229.4 194.8 345.8 315.5 373.5 158.8Bank loans n.e.c. .............................................................. 6.5 −6.0 23.2 30.7 18.9 7.2 41.1Other loans and advances ................................................ −20.1 63.0 37.5 61.7 32.7 76.0 82.3Mortgages ......................................................................... 6.2 7.5 10.1 7.3 8.0 8.0 8.0BY SECTOR ......................................................................................... 336.5 657.1 595.5 987.9 839.8 1,012.9 992.8Commercial banking .................................................................. 14.4 76.4 32.5 61.0 83.5 80.0 78.2Savings institutions ................................................................... −16.8 31.9 22.3 41.7 10.6 31.2 63.7Government-sponsored enterprises .......................................... −8.9 198.1 46.4 157.9 142.5 166.4 294.0Federally related mortgage pools ............................................. 114.6 88.1 114.6 140.3 84.8 247.0 267.5Asset-backed securities issuers ............................................... 85.8 120.7 226.2 385.1 254.4 367.2 272.4Finance companies .................................................................... 5.6 120.5 8.9 59.6 80.1 101.8 −13.6Funding corporations ................................................................. 129.7 −21.5 115.4 99.2 142.8 −28.6 −19.1Other 1 ........................................................................................ 12.2 42.9 29.1 43.2 41.0 48.0 49.6ALL SECTORSBY INSTRUMENT ................................................................................ 1,043.7 1,336.4 1,517.6 1,985.3 1,830.3 2,037.6 1,896.3Open market paper ................................................................... 199.3 107.7 171.7 257.7 347.3 116.6 236.2U.S. Government securities ....................................................... 170.6 242.6 191.3 338.9 197.3 342.5 425.1Municipal securities and loans ................................................. 34.1 59.6 88.9 103.2 116.7 100.1 84.1Corporate and foreign bonds .................................................... 156.6 354.2 418.1 452.7 487.0 641.8 212.0Bank loans n.e.c. ....................................................................... 146.5 123.6 62.2 185.1 79.9 172.9 187.2Other loans and advances ........................................................ 15.0 85.0 112.0 196.8 108.9 109.4 157.6Mortgages .................................................................................. 259.2 304.2 423.1 413.1 436.1 489.2 505.8Consumer credit ........................................................................ 62.5 59.5 50.3 37.8 57.3 65.1 88.2Source: Board of Governors of the Federal Reserve System.415


