

Economic Report President
Economic Report of the President - The American Presidency Project
Economic Report of the President - The American Presidency Project
- No tags were found...

Create successful ePaper yourself
Turn your PDF publications into a flip-book with our unique Google optimized e-Paper software.
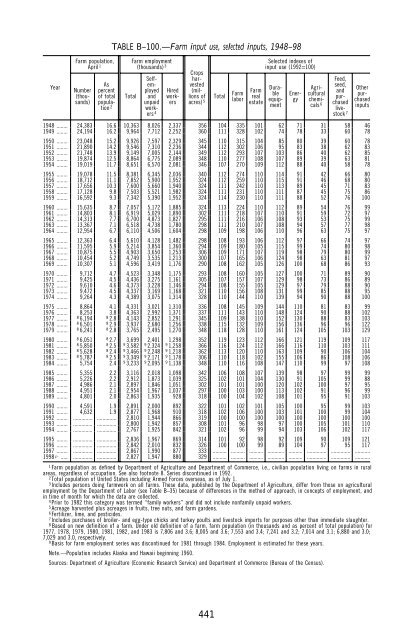
YearFarm population,April 1Number(thousands)Aspercentof totalpopulation2TABLE B–100.—Farm input use, selected inputs, 1948–98TotalFarm employment(thousands) 3Selfemployedandunpaidworkers4Cropsharvested(millionsofacres) 5TotalFarmlaborFarmrealestateSelected indexes ofinput use (1992=100)HiredworkersDurableequipmentEnergyAgriculturalchemicals6Feed,seed,andpurchasedlivestock7Otherpurchasedinputs1948 ........ 24,383 16.6 10,363 8,026 2,337 356 104 335 101 62 71 31 58 461949 ........ 24,194 16.2 9,964 7,712 2,252 360 111 328 102 74 78 33 60 781950 ........ 23,048 15.2 9,926 7,597 2,329 345 110 315 104 85 80 39 60 781951 ........ 21,890 14.2 9,546 7,310 2,236 344 112 302 106 95 83 38 62 831952 ........ 21,748 13.9 9,149 7,005 2,144 349 112 293 107 103 86 40 62 851953 ........ 19,874 12.5 8,864 6,775 2,089 348 110 277 108 107 89 39 63 811954 ........ 19,019 11.7 8,651 6,570 2,081 346 107 270 109 112 88 40 58 781955 ........ 19,078 11.5 8,381 6,345 2,036 340 112 274 110 114 91 42 66 801956 ........ 18,712 11.1 7,852 5,900 1,952 324 112 259 110 115 91 46 68 801957 ........ 17,656 10.3 7,600 5,660 1,940 324 111 242 110 113 89 45 71 831958 ........ 17,128 9.8 7,503 5,521 1,982 324 111 231 110 111 87 45 75 861959 ........ 16,592 9.3 7,342 5,390 1,952 324 114 230 110 111 88 52 76 1001960 ........ 15,635 8.7 7,057 5,172 1,885 324 113 224 110 112 89 54 76 991961 ........ 14,803 8.1 6,919 5,029 1,890 302 111 218 107 110 91 59 72 971962 ........ 14,313 7.7 6,700 4,873 1,827 295 111 216 106 108 93 53 75 991963 ........ 13,367 7.1 6,518 4,738 1,780 298 111 210 107 108 94 57 77 981964 ........ 12,954 6.7 6,110 4,506 1,604 298 109 198 106 110 96 63 75 971965 ........ 12,363 6.4 5,610 4,128 1,482 298 108 193 106 112 97 66 74 971966 ........ 11,595 5.9 5,214 3,854 1,360 294 109 180 105 115 99 74 80 981967 ........ 10,875 5.5 4,903 3,650 1,253 306 109 171 107 119 98 79 80 991968 ........ 10,454 5.2 4,749 3,535 1,213 300 107 165 106 124 98 63 81 971969 ........ 10,307 5.1 4,596 3,419 1,176 290 108 162 105 126 100 68 86 931970 ........ 9,712 4.7 4,523 3,348 1,175 293 108 160 105 127 100 71 89 901971 ........ 9,425 4.5 4,436 3,275 1,161 305 107 157 107 129 98 73 86 891972 ........ 9,610 4.6 4,373 3,228 1,146 294 108 155 105 129 97 79 88 901973 ........ 9,472 4.5 4,337 3,169 1,168 321 110 156 108 131 99 85 88 951974 ........ 9,264 4.3 4,389 3,075 1,314 328 110 144 110 139 94 90 88 1001975 ........ 8,864 4.1 4,331 3,021 1,310 336 108 145 109 144 110 81 83 991976 ........ 8,253 3.8 4,363 2,992 1,371 337 111 143 110 148 124 90 88 1021977 ........ 86,194 82.8 4,143 2,852 1,291 345 109 138 110 152 130 88 83 1031978 ........ 86,501 82.9 3,937 2,680 1,256 338 115 132 109 156 136 96 96 1221979 ........ 86,241 82.8 3,765 2,495 1,270 348 118 128 110 161 124 105 103 1291980 ........ 86,051 82.7 3,699 2,401 1,298 352 119 123 112 166 121 119 109 1171981 ........ 85,850 82.5 93,582 9 2,324 9 1,258 366 116 124 112 166 116 110 103 1111982 ........ 85,628 82.4 93,466 9 2,248 9 1,218 362 113 120 110 163 109 90 106 1041983 ........ 85,787 82.5 93,349 9 2,171 9 1,178 306 110 118 102 155 106 86 108 1061984 ........ 5,754 2.4 93,233 9 2,095 9 1,138 348 110 116 108 147 110 99 97 1081985 ........ 5,355 2.2 3,116 2,018 1,098 342 106 108 107 139 98 97 99 991986 ........ 5,226 2.2 2,912 1,873 1,039 325 102 101 104 130 91 105 99 881987 ........ 4,986 2.1 2,897 1,846 1,051 302 101 101 100 120 102 100 97 951988 ........ 4,951 2.1 2,954 1,967 1,037 297 100 103 100 113 102 91 96 991989 ........ 4,801 2.0 2,863 1,935 928 318 100 104 102 108 101 95 91 1031990 ........ 4,591 1.9 2,891 2,000 892 322 101 102 101 105 100 95 99 1031991 ........ 4,632 1.9 2,877 1,968 910 318 102 106 100 103 101 100 99 1041992 ........ .............. .............. 2,810 1,944 866 319 100 100 100 100 100 100 100 1001993 ........ .............. .............. 2,800 1,942 857 308 101 96 98 97 100 105 101 1101994 ........ .............. .............. 2,767 1,925 842 321 102 96 99 94 103 106 102 1171995 ........ .............. .............. 2,836 1,967 869 314 101 92 98 92 109 90 109 1211996 ........ .............. .............. 2,842 2,010 832 326 100 100 99 89 104 97 95 1171997 ........ .............. .............. 2,867 1,990 877 333 .......... .......... .......... ............ .......... .............. .............. ...........1998 p ..... .............. .............. 2,827 1,947 880 329 .......... .......... .......... ............ .......... .............. .............. ...........1Farm population as defined by Department of Agriculture and Department of Commerce, i.e., civilian population living on farms in ruralareas, regardless of occupation. See also footnote 8. Series discontinued in 1992.2Total population of United States including Armed Forces overseas, as of July 1.3Includes persons doing farmwork on all farms. These data, published by the Department of Agriculture, differ from those on agriculturalemployment by the Department of Labor (see Table B–35) because of differences in the method of approach, in concepts of employment, andin time of month for which the data are collected.4Prior to 1982 this category was termed ‘‘family workers’’ and did not include nonfamily unpaid workers.5Acreage harvested plus acreages in fruits, tree nuts, and farm gardens.6Fertilizer, lime, and pesticides.7Includes purchases of broiler- and egg-type chicks and turkey poults and livestock imports for purposes other than immediate slaughter.8Based on new definition of a farm. Under old definition of a farm, farm population (in thousands and as percent of total population) for1977, 1978, 1979, 1980, 1981, 1982, and 1983 is 7,806 and 3.6; 8,005 and 3.6; 7,553 and 3.4; 7,241 and 3.2; 7,014 and 3.1; 6,880 and 3.0;7,029 and 3.0, respectively.9Basis for farm employment series was discontinued for 1981 through 1984. Employment is estimated for these years.Note.—Population includes Alaska and Hawaii beginning 1960.Sources: Department of Agriculture (<strong>Economic</strong> Research Service) and Department of Commerce (Bureau of the Census).441


