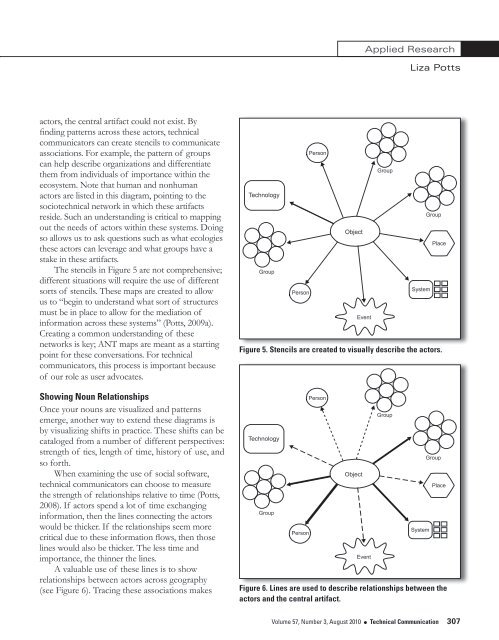
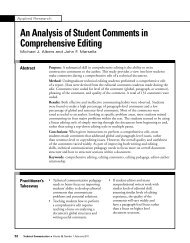
Applied ResearchConsuming Digital RightsAs we examine specific artifacts with ANT asour framework, it is valuable to note three stages ofmapping: actor networks; people, places, and things; andtemporal relationships (Potts, 2008).Adding NounsANT diagrams are powerful: They can reveal people,organizations, technologies, places, and events thataffect specific actor artifacts. By pointing to thesespecific artifacts, referred to as central actors, we canvisualize these ecosystems. By doing so, we are morelikely make more informed decisions concerning howwe design for these artifacts. Such design work rangesfrom the most basic of interaction choices to morecomplex legal decisions.At this stage, the goal is to locate the artifact thatis at the center of activity. A basic diagram of linesand circles begins the brainstorming session (Figure4). In Figure 4, we are mapping a central actor withinan experience that would not exist were it not forthe other actors within this diagram. After decidingon the central actor, the next step is to list all activeactors. Active actors include any and all technologies,TechnologyGroupPersonPersonObjectEventGroupGroupSystemPlaceFigure 4. Basic Actor Network diagram lists all of the actors (nouns).people, organizations, events, and any other human ornonhuman actors that must be present for the centralactor to exist. Obviously, the detail of these diagramscan become incredibly microscopic—listing minutiaesuch as Internet connections, power cables, and soforth—which is why it is critical to focus on the conceptof activity in defining these actors.These diagrams begin to sketch the ecosystemin which the artifact exists. By documenting thesenouns, the team can begin to see who or what anynew interfaces, processes, or systems will affect.Understanding these ecosystems is critical to designingthese experiences. Visualizing the people, organizations,and technologies involved in these experiences will helpinterdisciplinary teams share a common understandingabout the context in which the user will approach theseexperiences. Such understandings are critical for thedevelopment of user-centered experiences.Creating Noun StencilsFor the next stage, it is important to begin labelingthese nouns by using unique stencils recognizable towhoever will be examining and using these diagrams.It is critical “to distinguish the actors by nouncategories (people, places, things) pertinentto the community of practice for whichdevelopers are designing the system” (Potts,2008, p. 3).These diagrams also visualize shifts incultural practice. Such mapping extends ANT’svision of distributed agency, allowing designers,legal experts, and policy makers to view theactors. Within these visualizations, we can beginto discuss the design of systems, processes,and policies to support human work in a givenscenario: “By listing the actors, we gain a senseof who will be interacting and what theirmotivations might be with regards to their useof these systems” (Potts, 2009b).Figure 5 shows that many active actors comeinto play for any given artifact. In this diagram,the central actor is linked to various actors suchas people, places, events, technologies, andgroups that are present because they directlyaffect the central actor; without these supporting306 Technical Communication l Volume 57, Number 3, August 2010
Applied ResearchLiza Pottsactors, the central artifact couldPersonnot exist. Byfinding patterns across these actors, technicalcommunicators can create stencils to communicateassociations. For example, the pattern of groupscan help describe organizations and differentiatethem from individuals of importance within theecosystem. Note that human and nonhumanactors are listed in this diagram, pointing to thesociotechnical network in which these artifactsreside. Such an understanding is critical to mappingout the needs of actors within these systems. Doingso allows us to ask questions such as what ecologiesthese actors can leverage and what groups have astake in these artifacts.The stencils in Figure 5 are not comprehensive;different situations will require the use of differentsorts of stencils. These maps are created to allowus to “begin to understand what sort of structuresmust be in place to allow for the mediation ofinformation across these systems” (Potts, 2009a).Creating a common understanding of thesenetworks is key; ANT maps are meant as a startingpoint for these conversations. For technicalcommunicators, this process is important becauseof our role as user advocates.Showing Noun RelationshipsOnce your nouns are visualized and patternsemerge, another way to extend these diagrams isby visualizing shifts in practice. These shifts can becataloged from a number of different perspectives:strength of ties, length of time, history of use, andso forth.When examining the use of social software,technical communicators can choose to measurethe strength of relationships relative to time (Potts,2008). If actors spend a lot of time exchanginginformation, then the lines connecting the actorswould be thicker. If the relationships seem morecritical due to these information flows, then thoselines would also be thicker. The less time andimportance, the thinner the lines.A valuable use of these lines is to showrelationships between actors across geography(see Figure 6). Tracing these associations makesTechnologyGroupPersonObjectGroupGroupFigure 5. Stencils are created to visually describe the actors.TechnologyGroupPersonPersonPersonObjectEventEventGroupSystemSystemPlaceGroupPlaceFigure 6. Lines are used to describe relationships between theactors and the central artifact.Volume 57, Number 3, August 2010 l Technical Communication 307