DIPPED PRODUCTS PLC / ANNUAL REPORT 2008—2009
Annual Report- 2008/2009 - Colombo Stock Exchange
Annual Report- 2008/2009 - Colombo Stock Exchange
- No tags were found...

Create successful ePaper yourself
Turn your PDF publications into a flip-book with our unique Google optimized e-Paper software.
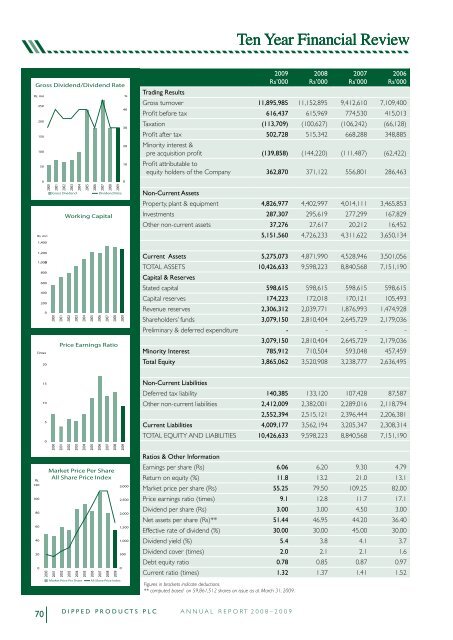
Ten Year Financial Review<br />
Gross Dividend/Dividend Rate<br />
Rs. mn %<br />
250<br />
40<br />
200<br />
30<br />
150<br />
20<br />
100<br />
10<br />
50<br />
2009<br />
Rs’000<br />
2008<br />
Rs’000<br />
2007<br />
Rs’000<br />
2006<br />
Rs’000<br />
Trading Results<br />
Gross turnover 11,895,985 11,152,895 9,412,610 7,109,400<br />
Profit before tax 616,437 615,969 774,530 415,013<br />
Taxation (113,709) (100,627) (106,242) (66,128)<br />
Profit after tax 502,728 515,342 668,288 348,885<br />
Minority interest &<br />
pre acquisition profit (139,858) (144,220) (111,487) (62,422)<br />
Profit attributable to<br />
equity holders of the Company 362,870 371,122 556,801 286,463<br />
0<br />
0<br />
Rs. mn<br />
1,400<br />
1,200<br />
1,0000<br />
800<br />
600<br />
400<br />
200<br />
0<br />
Times<br />
20<br />
2000<br />
2001<br />
2002<br />
2003<br />
2004<br />
2005<br />
2006<br />
2007<br />
2008<br />
2009<br />
Gross Dividend<br />
Dividend Rate<br />
Working Capital<br />
2000<br />
2001<br />
2002<br />
2003<br />
2004<br />
2005<br />
2006<br />
2007<br />
2008<br />
2009<br />
Price Earnings Ratio<br />
Non-Current Assets<br />
Property, plant & equipment 4,826,977 4,402,997 4,014,111 3,465,853<br />
Investments 287,307 295,619 277,299 167,829<br />
Other non-current assets 37,276 27,617 20,212 16,452<br />
5,151,560 4,726,233 4,311,622 3,650,134<br />
Current Assets 5,275,073 4,871,990 4,528,946 3,501,056<br />
TOTAL ASSETS 10,426,633 9,598,223 8,840,568 7,151,190<br />
Capital & Reserves<br />
Stated capital 598,615 598,615 598,615 598,615<br />
Capital reserves 174,223 172,018 170,121 105,493<br />
Revenue reserves 2,306,312 2,039,771 1,876,993 1,474,928<br />
Shareholders’ funds 3,079,150 2,810,404 2,645,729 2,179,036<br />
Preliminary & deferred expenditure - - - -<br />
3,079,150 2,810,404 2,645,729 2,179,036<br />
Minority Interest 785,912 710,504 593,048 457,459<br />
Total Equity 3,865,062 3,520,908 3,238,777 2,636,495<br />
Rs.<br />
120<br />
100<br />
80<br />
60<br />
40<br />
20<br />
15<br />
10<br />
5<br />
0<br />
2000<br />
2001<br />
2002<br />
2003<br />
2004<br />
2005<br />
2006<br />
2007<br />
2008<br />
2009<br />
Market Price Per Share<br />
All Share Price Index<br />
0 0<br />
2000<br />
2001<br />
2002<br />
2003<br />
2004<br />
2005<br />
2006<br />
2007<br />
2008<br />
2009<br />
3,000<br />
2,500<br />
2,000<br />
1,500<br />
1,000<br />
500<br />
Non-Current Liabilities<br />
Deferred tax liability 140,385 133,120 107,428 87,587<br />
Other non-current liabilities 2,412,009 2,382,001 2,289,016 2,118,794<br />
2,552,394 2,515,121 2,396,444 2,206,381<br />
Current Liabilities 4,009,177 3,562,194 3,205,347 2,308,314<br />
TOTAL EQUITY AND LIABILITIES 10,426,633 9,598,223 8,840,568 7,151,190<br />
Ratios & Other Information<br />
Earnings per share (Rs) 6.06 6.20 9.30 4.79<br />
Return on equity (%) 11.8 13.2 21.0 13.1<br />
Market price per share (Rs) 55.25 79.50 109.25 82.00<br />
Price earnings ratio (times) 9.1 12.8 11.7 17.1<br />
Dividend per share (Rs) 3.00 3.00 4.50 3.00<br />
Net assets per share (Rs)** 51.44 46.95 44.20 36.40<br />
Effective rate of dividend (%) 30.00 30.00 45.00 30.00<br />
Dividend yield (%) 5.4 3.8 4.1 3.7<br />
Dividend cover (times) 2.0 2.1 2.1 1.6<br />
Debt equity ratio 0.78 0.85 0.87 0.97<br />
Current ratio (times) 1.32 1.37 1.41 1.52<br />
Market Price Per Share<br />
All Share Price Index<br />
Figures in brackets indicate deductions.<br />
** computed based on 59,861,512 shares on issue as at March 31, 2009.<br />
70<br />
D I P P E D P R O D U C T S P L C A N N U A L R E P O R T 2 0 0 8 – 2 0 0 9