AUDIT ANALYTICS AUDIT
x8YaD9
x8YaD9
- No tags were found...

You also want an ePaper? Increase the reach of your titles
YUMPU automatically turns print PDFs into web optimized ePapers that Google loves.
ESSAY 5: DATA <strong>ANALYTICS</strong> FOR FINANCIAL STATEMENT <strong>AUDIT</strong>S<br />
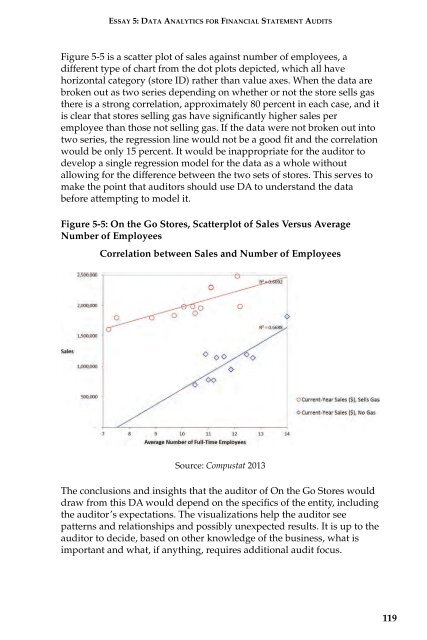
Figure 5-5 is a scatter plot of sales against number of employees, a<br />
different type of chart from the dot plots depicted, which all have<br />
horizontal category (store ID) rather than value axes. When the data are<br />
broken out as two series depending on whether or not the store sells gas<br />
there is a strong correlation, approximately 80 percent in each case, and it<br />
is clear that stores selling gas have significantly higher sales per<br />
employee than those not selling gas. If the data were not broken out into<br />
two series, the regression line would not be a good fit and the correlation<br />
would be only 15 percent. It would be inappropriate for the auditor to<br />
develop a single regression model for the data as a whole without<br />
allowing for the difference between the two sets of stores. This serves to<br />
make the point that auditors should use DA to understand the data<br />
before attempting to model it.<br />
Figure 5-5: On the Go Stores, Scatterplot of Sales Versus Average<br />
Number of Employees<br />
Correlation between Sales and Number of Employees<br />
Source: Compustat 2013<br />
The conclusions and insights that the auditor of On the Go Stores would<br />
draw from this DA would depend on the specifics of the entity, including<br />
the auditor’s expectations. The visualizations help the auditor see<br />
patterns and relationships and possibly unexpected results. It is up to the<br />
auditor to decide, based on other knowledge of the business, what is<br />
important and what, if anything, requires additional audit focus.<br />
119