AUDIT ANALYTICS AUDIT
x8YaD9
x8YaD9
- No tags were found...

Create successful ePaper yourself
Turn your PDF publications into a flip-book with our unique Google optimized e-Paper software.
<strong>AUDIT</strong> <strong>ANALYTICS</strong> AND CONTINUOUS <strong>AUDIT</strong>:LOOKING TOWARD THE FUTURE<br />
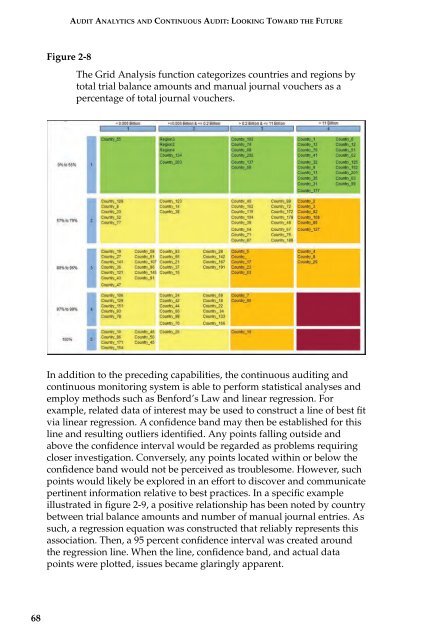
Figure 2-8<br />
The Grid Analysis function categorizes countries and regions by<br />
total trial balance amounts and manual journal vouchers as a<br />
percentage of total journal vouchers.<br />
In addition to the preceding capabilities, the continuous auditing and<br />
continuous monitoring system is able to perform statistical analyses and<br />
employ methods such as Benford’s Law and linear regression. For<br />
example, related data of interest may be used to construct a line of best fit<br />
via linear regression. A confidence band may then be established for this<br />
line and resulting outliers identified. Any points falling outside and<br />
above the confidence interval would be regarded as problems requiring<br />
closer investigation. Conversely, any points located within or below the<br />
confidence band would not be perceived as troublesome. However, such<br />
points would likely be explored in an effort to discover and communicate<br />
pertinent information relative to best practices. In a specific example<br />
illustrated in figure 2-9, a positive relationship has been noted by country<br />
between trial balance amounts and number of manual journal entries. As<br />
such, a regression equation was constructed that reliably represents this<br />
association. Then, a 95 percent confidence interval was created around<br />
the regression line. When the line, confidence band, and actual data<br />
points were plotted, issues became glaringly apparent.<br />
68