AUDIT ANALYTICS AUDIT
x8YaD9
x8YaD9
- No tags were found...

Create successful ePaper yourself
Turn your PDF publications into a flip-book with our unique Google optimized e-Paper software.
<strong>AUDIT</strong> <strong>ANALYTICS</strong> AND CONTINUOUS <strong>AUDIT</strong>:LOOKING TOWARD THE FUTURE<br />
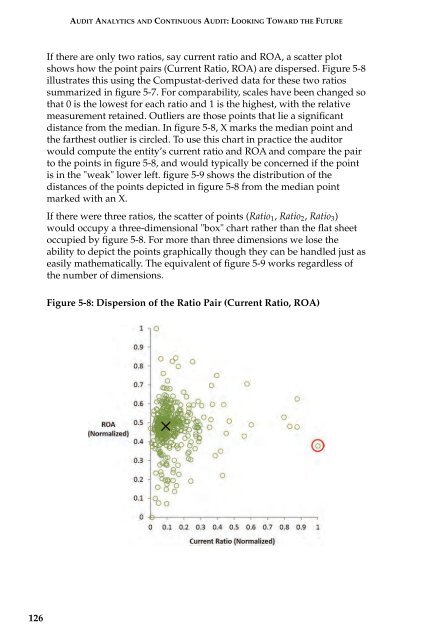
If there are only two ratios, say current ratio and ROA, a scatter plot<br />
shows how the point pairs (Current Ratio, ROA) are dispersed. Figure 5-8<br />
illustrates this using the Compustat-derived data for these two ratios<br />
summarized in figure 5-7. For comparability, scales have been changed so<br />
that 0 is the lowest for each ratio and 1 is the highest, with the relative<br />
measurement retained. Outliers are those points that lie a significant<br />
distance from the median. In figure 5-8, X marks the median point and<br />
the farthest outlier is circled. To use this chart in practice the auditor<br />
would compute the entity’s current ratio and ROA and compare the pair<br />
to the points in figure 5-8, and would typically be concerned if the point<br />
is in the "weak" lower left. figure 5-9 shows the distribution of the<br />
distances of the points depicted in figure 5-8 from the median point<br />
marked with an X.<br />
If there were three ratios, the scatter of points (Ratio 1 , Ratio 2 , Ratio 3 )<br />
would occupy a three-dimensional "box" chart rather than the flat sheet<br />
occupied by figure 5-8. For more than three dimensions we lose the<br />
ability to depict the points graphically though they can be handled just as<br />
easily mathematically. The equivalent of figure 5-9 works regardless of<br />
the number of dimensions.<br />
Figure 5-8: Dispersion of the Ratio Pair (Current Ratio, ROA)<br />
126