

Past Reports
2014vcpa
2014vcpa

Create successful ePaper yourself
Turn your PDF publications into a flip-book with our unique Google optimized e-Paper software.
India Venture Capital and Private Equity Report 2014<br />
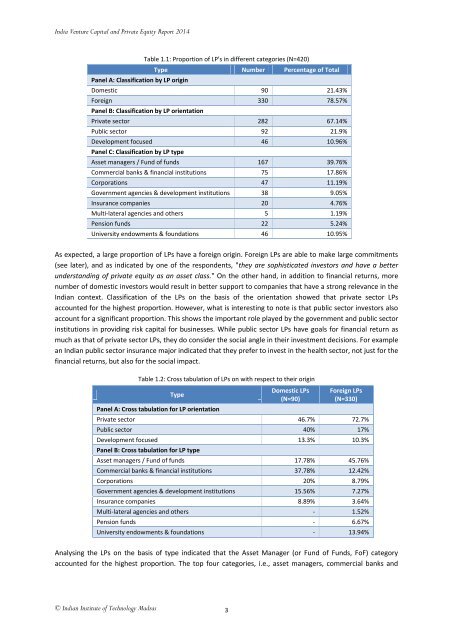
Table 1.1: Proportion of LP's in different categories (N=420)<br />
Type Number Percentage of Total<br />
Panel A: Classification by LP origin<br />
Domestic 90 21.43%<br />
Foreign 330 78.57%<br />
Panel B: Classification by LP orientation<br />
Private sector 282 67.14%<br />
Public sector 92 21.9%<br />
Development focused 46 10.96%<br />
Panel C: Classification by LP type<br />
Asset managers / Fund of funds 167 39.76%<br />
Commercial banks & financial institutions 75 17.86%<br />
Corporations 47 11.19%<br />
Government agencies & development institutions 38 9.05%<br />
Insurance companies 20 4.76%<br />
Multi-lateral agencies and others 5 1.19%<br />
Pension funds 22 5.24%<br />
University endowments & foundations 46 10.95%<br />
As expected, a large proportion of LPs have a foreign origin. Foreign LPs are able to make large commitments<br />
(see later), and as indicated by one of the respondents, "they are sophisticated investors and have a better<br />
understanding of private equity as an asset class." On the other hand, in addition to financial returns, more<br />
number of domestic investors would result in better support to companies that have a strong relevance in the<br />
Indian context. Classification of the LPs on the basis of the orientation showed that private sector LPs<br />
accounted for the highest proportion. However, what is interesting to note is that public sector investors also<br />
account for a significant proportion. This shows the important role played by the government and public sector<br />
institutions in providing risk capital for businesses. While public sector LPs have goals for financial return as<br />
much as that of private sector LPs, they do consider the social angle in their investment decisions. For example<br />
an Indian public sector insurance major indicated that they prefer to invest in the health sector, not just for the<br />
financial returns, but also for the social impact.<br />
Table 1.2: Cross tabulation of LPs on with respect to their origin<br />
Type<br />
Panel A: Cross tabulation for LP orientation<br />
Domestic LPs<br />
(N=90)<br />
Foreign LPs<br />
(N=330)<br />
Private sector 46.7% 72.7%<br />
Public sector 40% 17%<br />
Development focused 13.3% 10.3%<br />
Panel B: Cross tabulation for LP type<br />
Asset managers / Fund of funds 17.78% 45.76%<br />
Commercial banks & financial institutions 37.78% 12.42%<br />
Corporations 20% 8.79%<br />
Government agencies & development institutions 15.56% 7.27%<br />
Insurance companies 8.89% 3.64%<br />
Multi-lateral agencies and others - 1.52%<br />
Pension funds - 6.67%<br />
University endowments & foundations - 13.94%<br />
Analysing the LPs on the basis of type indicated that the Asset Manager (or Fund of Funds, FoF) category<br />
accounted for the highest proportion. The top four categories, i.e., asset managers, commercial banks and<br />
© Indian Institute of Technology Madras<br />
3