

Past Reports
2014vcpa
2014vcpa

You also want an ePaper? Increase the reach of your titles
YUMPU automatically turns print PDFs into web optimized ePapers that Google loves.
No. of US-based Public Pension FUnds in PE<br />
310<br />
300<br />
290<br />
280<br />
270<br />
260<br />
250<br />
240<br />
7.2% 299<br />
294<br />
7.0%<br />
6.8%<br />
266 266 266<br />
6.2%<br />
6.2%<br />
2010 2011 2012 2013 2014 YTD<br />
Year<br />
No. of US-based Public Pension Funds in PE<br />
Avg PE Allocation (% of AUM)<br />
7.4%<br />
7.2%<br />
7.0%<br />
6.8%<br />
6.6%<br />
6.4%<br />
6.2%<br />
6.0%<br />
5.8%<br />
5.6%<br />
Avg PE Allocation (in %)<br />
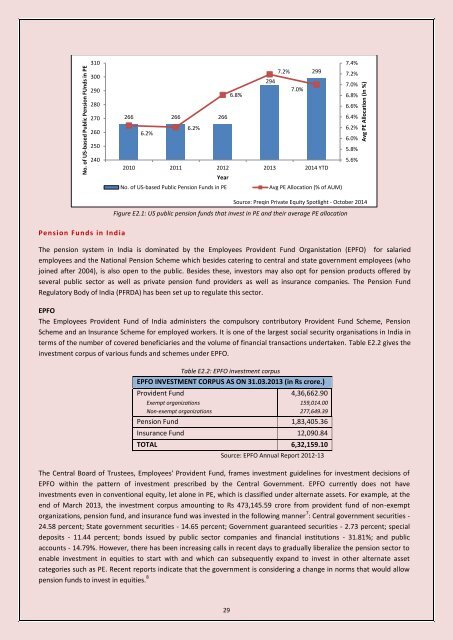
Source: Preqin Private Equity Spotlight - October 2014<br />
Figure E2.1: US public pension funds that invest in PE and their average PE allocation<br />
Pension Funds in Ind ia<br />
The pension system in India is dominated by the Employees Provident Fund Organistation (EPFO) for salaried<br />
employees and the National Pension Scheme which besides catering to central and state government employees (who<br />
joined after 2004), is also open to the public. Besides these, investors may also opt for pension products offered by<br />
several public sector as well as private pension fund providers as well as insurance companies. The Pension Fund<br />
Regulatory Body of India (PFRDA) has been set up to regulate this sector.<br />
EPFO<br />
The Employees Provident Fund of India administers the compulsory contributory Provident Fund Scheme, Pension<br />
Scheme and an Insurance Scheme for employed workers. It is one of the largest social security organisations in India in<br />
terms of the number of covered beneficiaries and the volume of financial transactions undertaken. Table E2.2 gives the<br />
investment corpus of various funds and schemes under EPFO.<br />
Table E2.2: EPFO investment corpus<br />
EPFO INVESTMENT CORPUS AS ON 31.03.2013 (in Rs crore.)<br />
Provident Fund<br />
Exempt organizations<br />
Non-exempt organizations<br />
4,36,662.90<br />
159,014.00<br />
277,649.39<br />
Pension Fund 1,83,405.36<br />
Insurance Fund 12,090.84<br />
TOTAL 6,32,159.10<br />
Source: EPFO Annual Report 2012-13<br />
The Central Board of Trustees, Employees' Provident Fund, frames investment guidelines for investment decisions of<br />
EPFO within the pattern of investment prescribed by the Central Government. EPFO currently does not have<br />
investments even in conventional equity, let alone in PE, which is classified under alternate assets. For example, at the<br />
end of March 2013, the investment corpus amounting to Rs 473,145.59 crore from provident fund of non-exempt<br />
organizations, pension fund, and insurance fund was invested in the following manner 7 : Central government securities -<br />
24.58 percent; State government securities - 14.65 percent; Government guaranteed securities - 2.73 percent; special<br />
deposits - 11.44 percent; bonds issued by public sector companies and financial institutions - 31.81%; and public<br />
accounts - 14.79%. However, there has been increasing calls in recent days to gradually liberalize the pension sector to<br />
enable investment in equities to start with and which can subsequently expand to invest in other alternate asset<br />
categories such as PE. Recent reports indicate that the government is considering a change in norms that would allow<br />
pension funds to invest in equities. 8<br />
29