

THE POLITICS OF IMMIGRATION
The-politics-of-immigration
The-politics-of-immigration

You also want an ePaper? Increase the reach of your titles
YUMPU automatically turns print PDFs into web optimized ePapers that Google loves.
Why didn’t the Lib Dems achieve a better result with the most<br />
liberal voters? In 2015, voters who shared the party’s liberal views<br />
on identity issues strongly opposed other aspects of their record in<br />
government. Age was a particularly important factor here. In particular,<br />
the party did especially badly with students and first-time voters. Our<br />
Survation poll gives them just a 4% share of 18-22 year olds, showing<br />
that the party’s liberal pitch entirely failed to lean into the significant<br />
intergenerational rise of more liberal attitudes.<br />
This reflects a dramatic reversal of what had happened in 2010. The<br />
Ipsos MORI “How Britain Voted” studies show the Lib Dems winning<br />
the support of 30% of 18-24 year olds in 2010, with an even three-way<br />
split between Labour, the Conservatives and the Lib Dems. By 2015, with<br />
the party defending its record in a Coalition government, including an<br />
infamous U-turn on tuition fees, Ipsos MORI shows a collapse to 5%<br />
of 18-24 year olds, with the Lib Dems falling behind UKIP among the<br />
youngest voters.<br />
***<br />
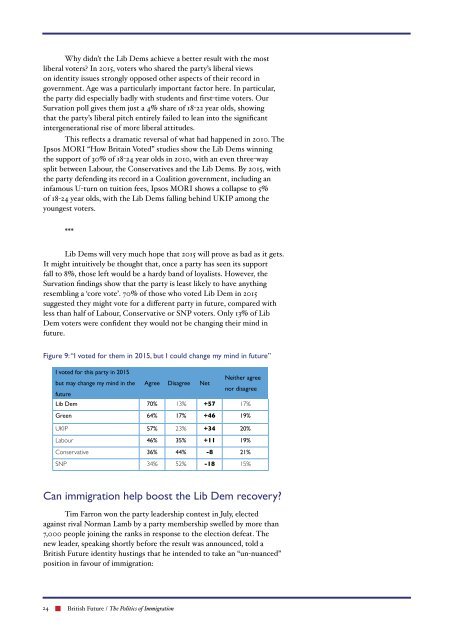
Lib Dems will very much hope that 2015 will prove as bad as it gets.<br />
It might intuitively be thought that, once a party has seen its support<br />
fall to 8%, those left would be a hardy band of loyalists. However, the<br />
Survation findings show that the party is least likely to have anything<br />
resembling a ‘core vote’. 70% of those who voted Lib Dem in 2015<br />
suggested they might vote for a different party in future, compared with<br />
less than half of Labour, Conservative or SNP voters. Only 13% of Lib<br />
Dem voters were confident they would not be changing their mind in<br />
future.<br />
Figure 9: “I voted for them in 2015, but I could change my mind in future”<br />
I voted for this party in 2015<br />
Neither agree<br />
but may change my mind in the Agree Disagree Net<br />
future<br />
nor disagree<br />
Lib Dem 70% 13% +57 17%<br />
Green 64% 17% +46 19%<br />
UKIP 57% 23% +34 20%<br />
Labour 46% 35% +11 19%<br />
Conservative 36% 44% -8 21%<br />
SNP 34% 52% -18 15%<br />
Can immigration help boost the Lib Dem recovery?<br />
Tim Farron won the party leadership contest in July, elected<br />
against rival Norman Lamb by a party membership swelled by more than<br />
7,000 people joining the ranks in response to the election defeat. The<br />
new leader, speaking shortly before the result was announced, told a<br />
British Future identity hustings that he intended to take an “un-nuanced”<br />
position in favour of immigration:<br />
24 British Future / The Politics of Immigration