

THE POLITICS OF IMMIGRATION
The-politics-of-immigration
The-politics-of-immigration

You also want an ePaper? Increase the reach of your titles
YUMPU automatically turns print PDFs into web optimized ePapers that Google loves.
non-white voters feel that Labour had too little to say about<br />
immigration. Most non-white voters thought the party got the balance<br />
about right in its 2015 campaign.<br />
Figure 27: Did Labour talk too much or too little about immigration?<br />
White (British) White (other) Mixed Asian Black<br />
Too much 10% 13% 11% 11% 8%<br />
About right 43% 66% 55% 58% 59%<br />
Too little 48% 21% 34% 31% 33%<br />
Why ethnic minorities still trust politicians on<br />
immigration<br />
Ethnic minority voters go somewhat against the political zeitgeist<br />
in being rather more inclined to trust politicians on immigration than<br />
their fellow citizens – though non-white Britons do make an exception for<br />
UKIP’s Nigel Farage.<br />
For ethnic minorities in 2015, the political leader who ethnic<br />
minorities trusted most on immigration was Labour leader Ed Miliband,<br />
while it is also striking that there were positive responses to leading figures<br />
across the party political spectrum, with David Cameron, Boris Johnson and<br />
outgoing Lib Dem leader Nick Clegg all winning net positive ratings.<br />
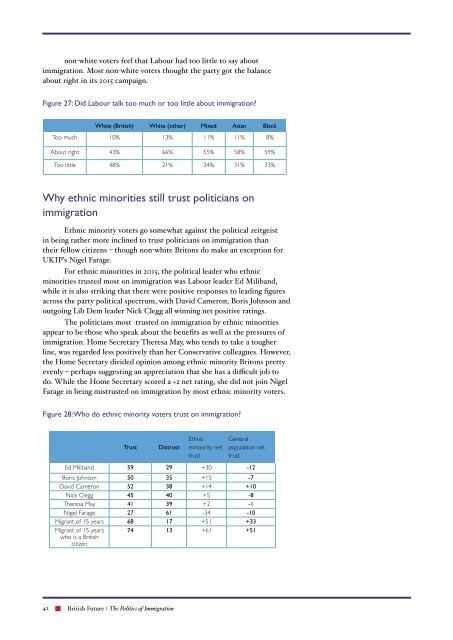
The politicians most trusted on immigration by ethnic minorities<br />
appear to be those who speak about the benefits as well as the pressures of<br />
immigration. Home Secretary Theresa May, who tends to take a tougher<br />
line, was regarded less positively than her Conservative colleagues. However,<br />
the Home Secretary divided opinion among ethnic minority Britons pretty<br />
evenly – perhaps suggesting an appreciation that she has a difficult job to<br />
do. While the Home Secretary scored a +2 net rating, she did not join Nigel<br />
Farage in being mistrusted on immigration by most ethnic minority voters.<br />
Figure 28: Who do ethnic minority voters trust on immigration?<br />
Trust<br />
Distrust<br />
Ethnic<br />
minonrity net<br />
trust<br />
General<br />
population net<br />
trust<br />
Ed Miliband 59 29 +30 -12<br />
Boris Johnson 50 35 +15 -7<br />
David Cameron 52 38 +14 +10<br />
Nick Clegg 45 40 +5 -8<br />
Theresa May 41 39 +2 -1<br />
Nigel Farage 27 61 -34 -10<br />
Migrant of 15 years 68 17 +51 +33<br />
Migrant of 15 years<br />
who is a British<br />
citizen<br />
74 13 +61 +51<br />
42 British Future / The Politics of Immigration