

THE POLITICS OF IMMIGRATION
The-politics-of-immigration
The-politics-of-immigration

Create successful ePaper yourself
Turn your PDF publications into a flip-book with our unique Google optimized e-Paper software.
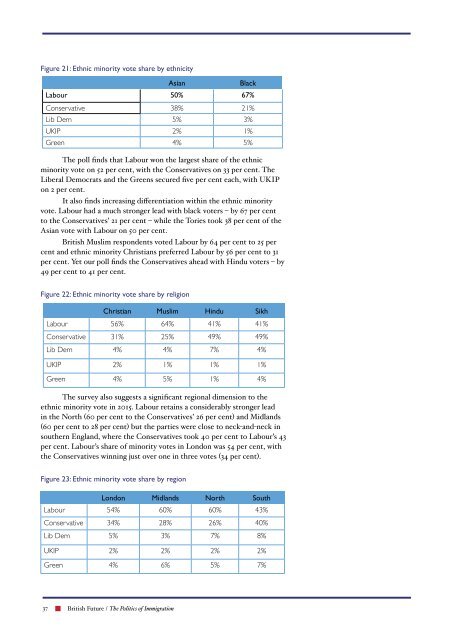
Figure 21: Ethnic minority vote share by ethnicity<br />
Asian<br />
Black<br />
Labour 50% 67%<br />
Conservative 38% 21%<br />
Lib Dem 5% 3%<br />
UKIP 2% 1%<br />
Green 4% 5%<br />
The poll finds that Labour won the largest share of the ethnic<br />
minority vote on 52 per cent, with the Conservatives on 33 per cent. The<br />
Liberal Democrats and the Greens secured five per cent each, with UKIP<br />
on 2 per cent.<br />
It also finds increasing differentiation within the ethnic minority<br />
vote. Labour had a much stronger lead with black voters – by 67 per cent<br />
to the Conservatives’ 21 per cent – while the Tories took 38 per cent of the<br />
Asian vote with Labour on 50 per cent.<br />
British Muslim respondents voted Labour by 64 per cent to 25 per<br />
cent and ethnic minority Christians preferred Labour by 56 per cent to 31<br />
per cent. Yet our poll finds the Conservatives ahead with Hindu voters – by<br />
49 per cent to 41 per cent.<br />
Figure 22: Ethnic minority vote share by religion<br />
Christian Muslim Hindu Sikh<br />
Labour 56% 64% 41% 41%<br />
Conservative 31% 25% 49% 49%<br />
Lib Dem 4% 4% 7% 4%<br />
UKIP 2% 1% 1% 1%<br />
Green 4% 5% 1% 4%<br />
The survey also suggests a significant regional dimension to the<br />
ethnic minority vote in 2015. Labour retains a considerably stronger lead<br />
in the North (60 per cent to the Conservatives’ 26 per cent) and Midlands<br />
(60 per cent to 28 per cent) but the parties were close to neck-and-neck in<br />
southern England, where the Conservatives took 40 per cent to Labour’s 43<br />
per cent. Labour’s share of minority votes in London was 54 per cent, with<br />
the Conservatives winning just over one in three votes (34 per cent).<br />
Figure 23: Ethnic minority vote share by region<br />
London Midlands North South<br />
Labour 54% 60% 60% 43%<br />
Conservative 34% 28% 26% 40%<br />
Lib Dem 5% 3% 7% 8%<br />
UKIP 2% 2% 2% 2%<br />
Green 4% 6% 5% 7%<br />
37 British Future / The Politics of Immigration