

+2%
BrandZ_2015_LATAM_Top50_Report
BrandZ_2015_LATAM_Top50_Report
- No tags were found...

You also want an ePaper? Increase the reach of your titles
YUMPU automatically turns print PDFs into web optimized ePapers that Google loves.
LATIN AMERICA<br />
PERFORMANCE BY INDUSTRY SECTOR<br />
TOP 50 MOST VALUABLE LATIN AMERICAN BRANDS 2015<br />
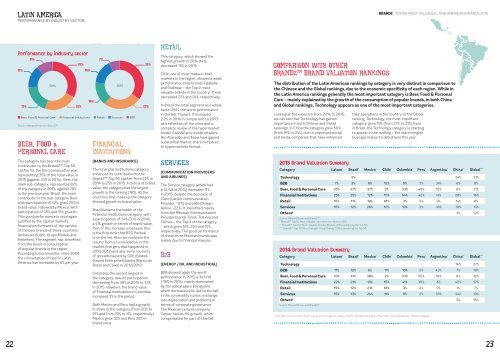
Performance by industry sector<br />
11% 7%<br />
33% 35%<br />
15% 16%<br />
19%<br />
2014<br />
Beer, Food & Personal Care<br />
Source: Millward Brown and BrandZ<br />
BEER, FOOD &<br />
PERSONAL CARE<br />
The category has been the main<br />
contributor to the BrandZ Top 50<br />
LatAm for the third consecutive year,<br />
representing 35% of the total value in<br />
2015 (against 33% in 2014). Beer, the<br />
main sub-category, represented 82%<br />
of the category in 2015, against 78%<br />
in the previous year. Brazil, the main<br />
contributor in the sub-category Beer<br />
with participation of 42%, grew 25% in<br />
brand value, followed by Mexico, with<br />
participation of 35% and 15% growth.<br />
This good performance is once again<br />
justified by the capital markets’<br />
financial performance of the owners<br />
of the beer brands of these countries<br />
(Anheuser Busch, Grupo Modelo and<br />
Heineken). The segment has benefited<br />
from the boost in consumption<br />
of popular brands in the region.<br />
According to Euromonitor, since 2008<br />
the consumption of beer in Latin<br />
America has increased by 6% per year.<br />
2015<br />
16%<br />
22% 25%<br />
Financial Institutions<br />
Retail Services B2B<br />
FINANCIAL<br />
INSTITUTIONS<br />
(BANKS AND INSURANCE)<br />
The Financial Institutions category<br />
enhanced its contribution to the<br />
BrandZ Top 50 LatAm, from 22% in<br />
2014 to 25% in 2015. In terms of brand<br />
value, the category had the largest<br />
growth in the ranking (18%). All the<br />
countries that make up the category<br />
showed growth in brand value.<br />
Brazil became the leader of the<br />
Financial Institutions category, with<br />
a participation of 34% (30% in 2014),<br />
a 41% growth in terms of brand value.<br />
Part of this increase is because this<br />
is the first time that BTG Pactual<br />
is on the list. Also, we could see the<br />
results from a consolidation in this<br />
market (mergers that happened in<br />
2010-2013) and also some recovery<br />
of spreads caused by SOE (Stated-<br />
Owned Enterprises) banks (Banco do<br />
Brasil and Caixa) in 2012/2013.<br />
Colombia, the second largest in<br />
the category, saw its participation<br />
decreasing from 39% in 2014 to 33%<br />
in 2015. However, the brand value<br />
of Financial Institutions in Colombia<br />
increased 3% in the period.<br />
Both Mexico and Peru had a growth<br />
in share in the category (from 20% to<br />
21% and from 10% to 11%, respectively).<br />
Mexico grew 32% and Peru 28% in<br />
brand value.<br />
RETAIL<br />
This category, which showed the<br />
highest growth in 2014 (14%),<br />
decreased 15% in 2015.<br />
Chile, one of most mature retail<br />
markets in the region, showed a weak<br />
performance in its brands Falabella<br />
and Sodimac – the Top 2 most<br />
valuable brands in the country. These<br />
decreased 23% and 24%, respectively.<br />
In Brazil the retail segment as a whole<br />
had in 2014 the worst performance<br />
in the last 11 years: it increased<br />
2.2% in 2014 in comparison to 2013<br />
as a reflection of the crisis and a<br />
complete review of the hypermarket<br />
model. Cash&Carry model retailers<br />
like Atacadão and Assai have gained<br />
substantial market share compared<br />
to hypermarkets format.<br />
SERVICES<br />
(COMMUNICATION PROVIDERS<br />
AND AIRLINES)<br />
The Service category (which had<br />
a 4% fall in 2014) increased 11%<br />
in 2015, despite the decrease of<br />
Claro (LatAm communication<br />
Provider, -12%) and LAN (Chilean<br />
Airline, -22%). It benefited mainly<br />
from the Mexican Communication<br />
Provider brands Telcel, Televisa and<br />
Telmex – the Top 3 of the category<br />
– which grew 16%, 22% and 15%,<br />
respectively. The good performance<br />
of these three Mexican brands was<br />
mainly due to financial reasons.<br />
B2B<br />
(ENERGY / OIL AND INDUSTRIAL)<br />
B2B showed again the worst<br />
performance in 2015, a 34% fall<br />
(-19% in 2014), mainly dominated<br />
by the subcategory Energy/Oil,<br />
which decreased 44% due to the fall<br />
in the commodity’s price, exchange<br />
rate depreciation and problems in<br />
terms of corporate governance.<br />
The Mexican cement company<br />
Cemex had an 11% growth, which<br />
compensated for part of this fall.<br />
COMPARISON WITH OTHER<br />
BRANDZ TM BRAND VALUATION RANKINGS<br />
The distribution of the Latin American rankings by category is very distinct in comparison to<br />
the Chinese and the Global rankings, due to the economic specificity of each region. While in<br />
the Latin America rankings generally the most important category is Beer, Food & Personal<br />
Care – mainly explained by the growth of the consumption of popular brands, in both China<br />
and Global rankings, Technology appears as one of the most important categories.<br />
Looking at the evolution from 2014 to 2015,<br />
we can see that Technology has gained<br />
importance in both Chinese and Global<br />
rankings. In China the category grew 50%<br />
(from 16% to 24%), due to important portal<br />
and media companies that have enhanced<br />
2015 Brand Valuation Summary<br />
their operations in the country. In the Global<br />
ranking, Technology, the most important<br />
category, grew 15% (from 27% to 31%). Even<br />
in Brazil, the Technology category is starting<br />
to appear in the ranking – the search engine<br />
Buscapé makes its debut here this year.<br />
Category Latam * Brazil * Mexico * Chile * Colombia * Peru * Argentina * China ** Global ***<br />
Technology 2% 24% 31%<br />
B2B 7% 3% 6% 12% 9% 3% 34% 6% 8%<br />
Beer, Food & Personal Care 35% 47% 37% 2% 33% 48% 16% 6% 11%<br />
Financial Institutions 25% 25% 12% 15% 44% 42% 14% 28% 16%<br />
Retail 16% 11% 19% 61% 3% 5% 0% 14% 8%<br />
Services 16% 12% 26% 10% 10% 2% 36% 19% 13%<br />
Others† 3% 12%<br />
Source: Millward Brown and BrandZ<br />
* BrandZ Top 50 Most Valuable Latin American Brands 2015<br />
** BrandZ Top 100 Most Valuable Chinese Brands 2015 (considering the Top 50)<br />
*** BrandZ Top 100 Most Valuable Global Brands 2015 (considering the Top 50)<br />
2014 Brand Valuation Summary<br />
Category Latam * Brazil * Mexico * Chile * Colombia * Peru * Argentina * China ** Global ***<br />
Technology 16% 27%<br />
B2B 11% 12% 6% 11% 15% 2% 43% 7% 10%<br />
Beer, Food & Personal Care 33% 41% 38% 2% 33% 56% 18% 8% 12%<br />
Financial Institutions 22% 21% 10% 15% 41% 39% 6% 40% 17%<br />
Retail 19% 12% 21% 61% 3% 2% 0% 1% 7%<br />
Services 15% 13% 24% 11% 9% 2% 33% 24% 13%<br />
Others† 3% 15%<br />
Source: Millward Brown and BrandZ<br />
† Cars, Motor Cycles, Motor Fuels, Lubricants, Detergents, Jewelry, Paints, Mosquito Repellents, Real State, Home Appliances, Tobacco, Apparel.<br />
22 23