Annual Report 2010-11
Annual Report 2010-11 - Kribhco
Annual Report 2010-11 - Kribhco
- No tags were found...

Create successful ePaper yourself
Turn your PDF publications into a flip-book with our unique Google optimized e-Paper software.
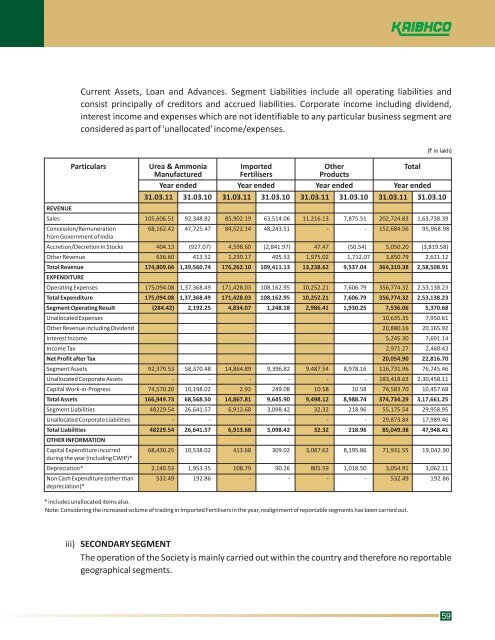
Current Assets, Loan and Advances. Segment Liabilities include all operating liabilities and<br />
consist principally of creditors and accrued liabilities. Corporate income including dividend,<br />
interest income and expenses which are not identifiable to any particular business segment are<br />
considered as part of 'unallocated' income/expenses.<br />
REVENUE<br />
Particulars<br />
Urea & Ammonia<br />
Manufactured<br />
Year ended<br />
31.03.<strong>11</strong> 31.03.10<br />
Imported<br />
Fertilisers<br />
Year ended<br />
31.03.<strong>11</strong> 31.03.10<br />
Other<br />
Products<br />
Year ended<br />
31.03.<strong>11</strong> 31.03.10<br />
Sales 105,606.51 92,348.82 85,902.19 63,514.06 <strong>11</strong>,216.13 7,875.51 202,724.83 1,63,738.39<br />
Concession/Remuneration 68,162.42 47,725.47 84,522.14 48,243.51 - - 152,684.56 95,968.98<br />
from Government of India<br />
Accretion/Decretion In Stocks 404.13 (927.07) 4,598.60 (2,841.97) 47.47 (50.54) 5,050.20 (3,819.58)<br />
Other Revenue 636.60 413.52 1,239.17 495.53 1,975.02 1,712.07 3,850.79 2,621.12<br />
Total Revenue 174,809.66 1,39,560.74 176,262.10 109,4<strong>11</strong>.13 13,238.62 9,537.04 364,310.38 2,58,508.91<br />
EXPENDITURE<br />
Operating Expenses 175,094.08 1,37,368.49 171,428.03 108,162.95 10,252.21 7,606.79 356,774.32 2,53,138.23<br />
Total Expenditure 175,094.08 1,37,368.49 171,428.03 108,162.95 10,252.21 7,606.79 356,774.32 2,53,138.23<br />
Segment Operating Result (284.42) 2,192.25 4,834.07 1,248.18 2,986.41 1,930.25 7,536.06 5,370.68<br />
Unallocated Expenses 10,635.35 7,950.61<br />
Other Revenue including Dividend 20,880.16 20,165.92<br />
Interest Income 5,245.30 7,691.14<br />
Income Tax 2,971.27 2,460.43<br />
Net Profit after Tax 20,054.90 22,816.70<br />
Segment Assets 92,379.53 58,370.48 14,864.89 9,396.82 9,487.54 8,978.16 <strong>11</strong>6,731.96 76,745.46<br />
Unallocated Corporate Assets - - - - - - 183,418.63 2,30,458.<strong>11</strong><br />
Capital Work-in-Progress 74,570.20 10,198.02 2.92 249.08 10.58 10.58 74,583.70 10,457.68<br />
Total Assets 166,949.73 68,568.50 14,867.81 9,645.90 9,498.12 8,988.74 374,734.29 3,17,661.25<br />
Segment Liabilities 48229.54 26,641.57 6,913.68 3,098.42 32.32 218.96 55,175.54 29,958.95<br />
Unallocated Corporate Liabilities - - - - - - 29,873.84 17,989.46<br />
Total Liabilities 48229.54 26,641.57 6,913.68 3,098.42 32.32 218.96 85,049.38 47,948.41<br />
OTHER INFORMATION<br />
Capital Expenditure incurred 68,430.25 10,538.02 413.68 309.02 3,087.62 8,195.86 71,931.55 19,042.90<br />
during the year (including CWIP)*<br />
Depreciation* 2,140.53 1,953.35 108.79 90.26 805.59 1,018.50 3,054.91 3,062.<strong>11</strong><br />
Non Cash Expenditure (other than 532.49 192.86 - - - - 532.49 192.86<br />
depreciation)*<br />
* includes unallocated items also.<br />
Note: Considering the increased volume of trading in Imported Fertilisers in the year, realignment of reportable segments has been carried out.<br />
Total<br />
( ` inlakh)<br />
Year ended<br />
31.03.<strong>11</strong> 31.03.10<br />
iii)<br />
SECONDARY SEGMENT<br />
The operation of the Society is mainly carried out within the country and therefore no reportable<br />
geographical segments.<br />
59