Chapter 131

You also want an ePaper? Increase the reach of your titles
YUMPU automatically turns print PDFs into web optimized ePapers that Google loves.
Quality Improvement<br />
Sally E. Rampersad and Lynn D. Martin<br />
<strong>131</strong><br />
CHAPTER<br />
INTRODUCTION<br />
In spite of numerous advances in medicine and technology,<br />
the modern health care system continues to perform far below<br />
acceptable levels in ensuring patient safety and addressing patient<br />
needs. 1 Patient safety concerns are far too common in the operative<br />
setting. Consider, as an example of this system failure, the<br />
lethal heart-lung transplantation of a ABO-incompatible organ<br />
into a 17-year-old girl at a well-respected U.S. medical center. 2<br />
How could the most technologically advanced health-care system<br />
in the world produce such results? The answer lies deep within<br />
the landmark article published in the 1999 Institute of Medicine<br />
(IOM) report “To Err is Human: Building a Safer Health System,”<br />
medical error is a failure of process. 3 This report galvanized health<br />
care system response and public demand for change when the U.S.<br />
population learned that medical errors cause 44,000 to 98,000<br />
deaths annually. These errors are estimated to account for more<br />
than $9 billion per year in lost productivity and nearly $2 billion<br />
per year in hospital costs. 4<br />
The Merriam-Webster Online dictionary defines quality assurance<br />
(QA) as “a program for systematic monitoring and evaluation<br />
of the various aspects of a project, service or facility to ensure that<br />
standards of quality are met.” Definitions for quality include<br />
“degree of excellence: grade: superiority in kind.” Improvement is<br />
defined as “the act or process of improving; the state of being<br />
improved, especially enhanced value or excellence.” 5<br />
IOM’s Committee on the Quality of Health Care in America<br />
outlined six aims to improve key dimensions in our healthcare<br />
systems. Health care should be:<br />
Safe—avoiding injuries to patients from the care intended to help<br />
them<br />
Effective—providing services based on scientific knowledge to all<br />
who could benefit and refraining from providing services to<br />
those not likely to benefit (avoiding underuse and overuse)<br />
Patient-centered—providing care that is respectful of and responsive<br />
to individual patients’ preferences, needs, and values and<br />
ensuring that parental expectations and values guide all clinical<br />
decisions<br />
Timely—reducing waits and sometimes harmful delays for both<br />
those who receive and those who provide care<br />
Efficient—avoiding waste, including waste of equipment, supplies,<br />
ideas, and energy<br />
Equitable—providing care that does not vary in quality because<br />
of personal characteristics such as gender, ethnicity, geographic<br />
location, or socioeconomic status<br />
In this chapter we will trace the history of quality improvement<br />
(QI) in pediatric anesthesia and will describe some of the<br />
methodologies used for quality improvement today. We will use a<br />
template to describe a pediatric case in which there were QA/QI<br />
issues and will demonstrate how this can be effectively applied to<br />
other cases, to direct QA/QI discussion away from personal fault<br />
finding and toward fixing broken systems. Finally, we will consider<br />
the evolution of error models and introduce a new 2-dimensional<br />
dynamic error model recently described by one of the authors (SR). 6<br />
HISTORY<br />
QA/QI programs inevitably look at morbidity and mortality as an<br />
important outcome measure. These are considered in <strong>Chapter</strong> 127<br />
but some landmark morbidity and mortality studies are con -<br />
sidered here for their historic significance.<br />
John Snow wrote two of the earliest texts on anesthesia: On the<br />
Inhalation of the Vapour of Ether and On Chloroform and Other<br />
Anaesthetics. 7,8 In these works, Snow described in detail the clinical<br />
effects of the inhaled anesthetic vapors, including the potential for<br />
respiratory depression and cardiac arrest. He followed reports of<br />
deaths from chloroform in the medical literature and commented<br />
upon them. 9 Having performed some animal experiments himself,<br />
he had determined that 4% was an appropriate concentration of<br />
chloroform to administer and cautioned against the use of higher<br />
concentrations.<br />
One of the first comprehensive reviews looking at the safety of<br />
anesthesia was the Beecher and Todd study in 1954. 10 In the<br />
conclusions of this study, the special needs of pediatric patients<br />
were acknowledged. “Again and again in the preceding pages we<br />
have pointed out specific areas worthy of ardent attack: for<br />
example, the question of why the anesthesia death rate is so disproportionately<br />
high in the first decade of life …”<br />
In the United Kingdom in 1987, the Confidential Enquiry into<br />
Perioperative Deaths (CEPOD) was another comprehensive<br />
examination of perioperative risks. 11 Deaths within 30 days of<br />
surgery were reported to CEPOD and then a detailed questionnaire<br />
was mailed out to those involved in care, both from surgery<br />
and anesthesia. Subsequently, the group looked at subsets of<br />
surgeries and groups of patients that seemed to be at particularly<br />
high risk. In an editorial in the Lancet, Lunn and Devlin reported<br />
that CEPOD “sought to establish facts about the delivery of surgery<br />
and anesthesia and thus, facilitate improvements in the<br />
delivery of surgical care.” They also concluded that “It is important<br />
that consistent protocols are created so that continuity of care is<br />
maintained when weekends or staff holidays are interspersed in a<br />
patient’s stay in hospital …. Anaesthetists have a peculiarly<br />
difficult role … and their position could be strengthened if defined<br />
guidelines were available for everyone.” 12 Thus, their goal was
2144 PART 6 ■ Specific Considerations<br />
quality improvement and a tool that they recommended was the<br />
use of “standard operating procedures” that will be discussed in<br />
more detail later.<br />
The Australian Patient Safety Foundation was formed in 1987.<br />
It decided to set up and coordinate the Australian Incident<br />
Monitoring Study (AIMS). 13 An important feature of this study<br />
was that the reports were anonymous and voluntary. Voluntary<br />
reporting, however, has been shown in several studies to fall far<br />
short of the goal of detecting all undesirable clinical events. 14–16<br />
Any unintended incident which reduced, or could have<br />
reduced, the safety margin for a patient was reportable to AIMS.<br />
All reports were welcome whether or not the reporter deemed that<br />
the incident was preventable or that it involved human error.<br />
Contributing factors and factors minimizing any adverse outcome<br />
were considered and suggestions for corrective strategies could be<br />
made within the initial report. The guaranteed anonymity and<br />
medicolegal protection of the reporter increased the likelihood<br />
that details would be reported. Although the reporting of “nearmisses”<br />
was encouraged, there was probably a tendency, as<br />
previously noted by Flanagan, 17 to underreport events that were<br />
considered mundane and that did not result in patient harm. The<br />
major conclusions of the AIMS data were similar to those from a<br />
previous study by Cooper, 18 which showed that 83% of preventable<br />
incidents involved human error.<br />
In 1985, the Committee on Professional Liability of the<br />
American Society of Anesthesiologists began gathering data and<br />
evaluating closed anesthesia malpractice claims. Claims in the<br />
pediatric age group (15 years or younger) were examined as subset.<br />
19 A major conclusion of this comparison was that in pediatric<br />
closed claims there was a large prevalence of respiratory-related<br />
damaging events (43% in pediatric claims vs 30% in adult claims);<br />
mortality was greater in pediatric vs adult claims (50% vs 35%),<br />
and care was judged to be less than appropriate more often in the<br />
pediatric cases (54% in pediatric claims vs 44% in adult claims).<br />
Kennan et al. found that bradycardia, which is often an indicator<br />
of hypoxia and/or an early sign of hemodynamic instability, was<br />
less than half as likely to occur when a pediatric anesthesiologist<br />
was supervising the case. 20 Several authors have reported an<br />
increased incidence of perioperative cardiac arrest in infants. 21–24<br />
The Pediatric Perioperative Cardiac Arrest (POCA) Registry data<br />
also suggest that infants are at increased risk, as are children with<br />
severe underlying disease and those having emergency surgery. 25,26<br />
Such studies have led to recommendations as to who should be<br />
performing pediatric anesthesia and what training is acceptable. 27–35<br />
Matching provider and facility capabilities to the needs of pediatric<br />
patients, who have been identified as a particularly fragile group<br />
of patients, is essential if quality care is to be provided.<br />
QA/QI METHODOLOGIES<br />
Quality improvement efforts originated in the manufacturing<br />
settings. Many of the tools and methods developed in this setting<br />
have been applied successfully in health care. The most common<br />
QA/QI methodologies currently used in the health care setting are<br />
the plan-do-check-act (PDCA) cycle, Six Sigma, lean strategies,<br />
and Failure Modes Effects Analysis (FMEA). We will provide brief<br />
summaries of each method.<br />
The measurement of defects is a central component of quality<br />
improvement. The systemic measurement of a process demonstrates<br />
whether improvement efforts (1) lead to change in the<br />
primary endpoint in the desired direction, (2) contribute to<br />
unintended results in different part of the process, and (3) require<br />
additional efforts to bring the process back into acceptable ranges.<br />
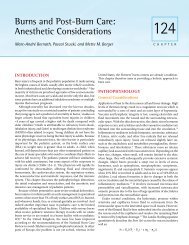
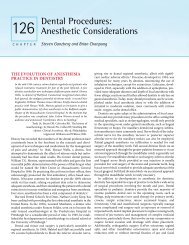
One primary tool used by quality improvement professionals is a<br />
run chart. The number of successful outcomes is divided by the<br />
number of total opportunities for the desired variable and graphed<br />
versus time (Figure <strong>131</strong>–1). The mean line can be used in the run<br />
chart to clarify movement of data away from the mean. Two other<br />
commonly calculated variables are the upper control limit and the<br />
lower control limit. As long as the data points remain within these<br />
control limits, the process is under control and further action is<br />
not necessary. Quality improvement efforts would expected to<br />
decrease the mean, upper, and lower control limits.<br />
Considered by many the first medical quality improvement<br />
leader, Avedis Donabedian described quality design in relationship<br />
to structure, process and outcomes. 36 Structural measures assess<br />
the availability and quality of resources, management systems, and<br />
policy guidelines and are often critical to sustaining processes<br />
over time. Although commonly used for licensing and hospital<br />
accreditation, an example in health care would be the decision to<br />
use intensivists in the intensive care unit to decrease mortality. 37<br />
Process measures use the actual process of health care delivery as<br />
the indicator of quality by analyzing the activities of physicians or<br />
other health care professionals to determine whether medicine is<br />
practiced according to guidelines. A current example of a process<br />
measure would be the proportion of diabetic patients who undergo<br />
an annual retinal examination. Outcomes measures evaluate the<br />
result of health care and often depend not only on medical care<br />
but also on genetic, environmental, and behavioral factors. Outcomes<br />
are usually based on group results rather than individual<br />
cases and thus, are not an indicator of quality of care delivered to<br />
an individual patient. Examples of outcome measures include<br />
mortality and patient satisfaction data.<br />
Historically (Table <strong>131</strong>–1), health care has focused on quality<br />
assurance (i.e., a system for evaluating the delivery of services or<br />
the quality of products) and quality control (i.e., a system for<br />
verifying and maintaining a desired level of quality). Used alone,<br />
these methods are not sufficient to enhance outcomes. Checking<br />
for defects and recommending changes without understanding<br />
the causes and recognizing the effects of these changes on other<br />
parts of the organization may improve one process but harm<br />
others. Therefore, most operating rooms are combining quality<br />
assurance and proactive quality improvement.<br />
Continuous QA/QI is based on the principle that opportunity<br />
for improvement exists in every process on every occasion. 38 The<br />
continuous QA/QI model underscores the view of health care as a<br />
process and focuses on the system rather than the individual when<br />
considering improvement opportunities. Continuous QA/QI re -<br />
quires a commitment to constantly improve operations, processes,<br />
and activities commonly using statistical methods to meet patient<br />
needs in a cost-effective, efficient, and reliable manner.<br />
The choice of methodology depends on the nature of<br />
the improvement project. Within most methodologies, users will<br />
find similar techniques. Most methodologies typically include<br />
iterative testing of ideas and redesign of process or technology<br />
based on lessons learned commonly using statistical methods.<br />
More recently, some experts have begun using principles<br />
from different methodologies for the same project (i.e., the use of<br />
“lean-sigma” methodology), thereby making distinctions less<br />
relevant.
CHAPTER <strong>131</strong> ■ Quality Improvement 2145<br />
Figure <strong>131</strong>-1. Run chart—department of pediatric anesthesia.<br />
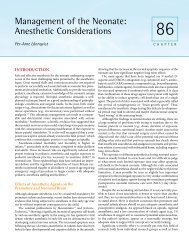
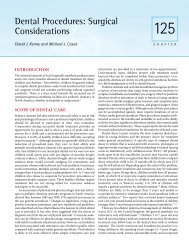
PDCA Cycle<br />
The PDCA cycle is the most commonly utilized approach for rapid<br />
cycle improvement in health care. This method involves a trial and<br />
learning approach in which a hypothesis or suggested solution for<br />
improvement is made and testing is carried out on a small scale<br />
before any changes are made to a whole system. 39 A logical<br />
sequence of four repetitive steps is carried out over a course of<br />
small cycles, which eventually leads to exponential improvements<br />
(see figure 2). During the “plan” phase, ideas for improvement are<br />
defined, tasks assigned and expectations confirmed. Measures of<br />
improvement (metrics) are then selected. In the “do” phase, the<br />
plan is implemented and any deviation (defects) from the plan<br />
documented. The defects are analyzed in the “check” phase. In this<br />
phase the results from the test cycle are studied and questions<br />
are asked regarding what went wrong and what will be changed<br />
in the next test cycle. In the final “act” phase, lessons learned from<br />
the check phase are incorporated into the test of change and a<br />
TABLE <strong>131</strong>-1. Evolution of Quality Improvement Efforts in Hospitals<br />
Era Quality Effort Name Strategy<br />
1950s<br />
1980s<br />
1990s<br />
2000s<br />
Quality Assurance<br />
Quality Improvement<br />
Quality Management<br />
Industrial Methods<br />
Quality (PDCA) Cycle<br />
Six Sigma (Motorola)<br />
Lean (Toyota)<br />
Failure Modes and<br />
Effects Analysis<br />
Identify outliers in clinical care to eliminate these outliers from within the organization<br />
Decrease variation to reduce error as well as improve clinical and nonclinical processes<br />
Use managerial concepts centered on quality improvement to achieve technical quality and<br />
customer satisfaction<br />
Trial and learning approach in which a hypothesis or suggestion for improvement is made<br />
and tested on a small scale before changes are made to a whole system<br />
Achieve defect-free processes and reduce variance through Six Sigma improvement projects<br />
Identify customer demands and improve process by removing non–value added steps<br />
(waste) from the system<br />
Evaluate processes for possible failures and effects; prevent failure by correcting the<br />
processes proactively rather than reacting to adverse events
2146 PART 6 ■ Specific Considerations<br />
test a hypothesis. In the improve step, creative solutions and<br />
implementation plans are developed. In the final control step, the<br />
process is controlled by implementing policies, guidelines, errorproofing<br />
strategies, and monitoring with control charts.<br />
Figure <strong>131</strong>-2. Plan-Do-Check-Act (PDCA) CYCLE.<br />
decision is made in continuation of the test cycles. Then the entire<br />
cycle is repeated again.<br />
Six Sigma<br />
Bill Smith, a reliability engineer at Motorola in 1986, is known as<br />
the “Father of Six Sigma.” Six Sigma is a business management<br />
strategy based on rigorous statistical measurement designed to<br />
reduce cost, decrease process variation, and eliminate defects. 40<br />
However, Six Sigma took off as a significant quality movement in<br />
the mid-1990s when Jack Welch, chief executive officer of General<br />
Electric, launched Six Sigma, calling it the most ambitious task the<br />
company had ever taken on. 41 “Sigma” is used to present the<br />
standard deviation of a population or given process. For normally<br />
distributed data, the Six Sigma level defines a process has having<br />
3.4 defects per million opportunities (DPMO) and is virtually<br />
error free (99.9997%) (Table <strong>131</strong>–2). Once DPMO has been<br />
calculated, sigma values can be looked up in tables or software<br />
packages. Teams can then identify process capabilities and the<br />
level of intended magnitude of improvement.<br />
Six Sigma improvements are achieved through a series of steps:<br />
define, measure, analyze, improve, and control (DMAIC). The<br />
define step entails the creation of a chart that defines the customer’s<br />
needs, project scope, goals, success criteria, team members, and<br />
project deadlines. In the measurement step, a data collection plan<br />
for the process developed and data are collected from several<br />
sources to determine the depth of defects or errors in the system.<br />
Control charts are commonly utilized to further control the<br />
process. In the analyze step, data analysis occurs, deviation from<br />
standard is identified, and sources of process variation are used to<br />
Lean Strategy<br />
Building on the work of several pioneers (Henry Ford at the Ford<br />
Motor Company and W. Edward Deming, the originator of the<br />
concept of total quality management), Taiichi Ohno, a Toyota<br />
Motor Corporation engineer, revolutionized thinking regarding<br />
process inefficiency or “waste” in the early 1950s, leading to the<br />
development of the Toyota Production System (TPS). 42 Building<br />
on the Deming Cycle as a systematic approach to problem solving,<br />
a continuous quality-improvement model consisting of a logical<br />
sequence of four repetitive steps, Toyota has been able to use the<br />
TPS to become the largest and most profitable automobile<br />
manufacturer in the world. James Womack and Daniel T. Jones<br />
first characterized TPS as “lean thinking” because world-class<br />
companies—those with the best production systems—require less<br />
of everything to produce higher-quality products. 43 As noted in<br />
their book, lean means:<br />
●<br />
●<br />
●<br />
●<br />
●<br />
●<br />
●<br />
●<br />
Half the space<br />
Half the investment in tools<br />
Half the human effort in the factory<br />
Half the time to produce the product<br />
At least half the inventory on hand<br />
Greater flexibility to produce a variety of products based on customer<br />
demand<br />
Fewer defects<br />
Lower cost<br />
Lean philosophy is driven by the desire to identify needs of the<br />
customer and aims to improve processes and thus, quality by<br />
removing non–value added activities (Figure <strong>131</strong>–3). Non-value<br />
TABLE <strong>131</strong>-2. Sigma Levels<br />
Defects per Million<br />
Sigma Level Accuracy, % Opportunities<br />
1 30.85 690,000<br />
2 69.15 308,537<br />
3 93.32 66,807<br />
4 99.38 6,210<br />
5 99.977 233<br />
6 99.9997 3.4<br />
Figure <strong>131</strong>-3. Lean philosophy—quality.
CHAPTER <strong>131</strong> ■ Quality Improvement 2147<br />
Figure <strong>131</strong>-4. Lean philosophy—waste types.<br />
added activities, more commonly know as waste, do not add to the<br />
business margin or the customer’s experience, and the customer is<br />
often not willing to pay for them. Eight different types of waste have<br />
been described (Figure <strong>131</strong>–4). Lean tools and methods are<br />
designed to maximize value-added steps in the best possible<br />
sequence to deliver continuous flow. Services are delivered where,<br />
when, and how the customer needs them. To create and maintain<br />
an organized, cost-efficient workplace that has clear (visual) work<br />
processes and standards, lean experts use five S tools (Figure <strong>131</strong>–<br />
5). The degree of organization of each of the five Ss can also be<br />
quantified (Figure <strong>131</strong>–6). Daily maintenance and weekly auditing<br />
are necessary to sustain the organization of the workplace.<br />
One of the most important tools in lean methodology is called<br />
value stream mapping (VSM). This tool graphically displays the<br />
process of services or product delivery with use of inputs,<br />
throughputs, and outputs. A current VSM is typically done at the
2148 PART 6 ■ Specific Considerations<br />
Figure <strong>131</strong>-5. Lean philosophy—5 Ss.<br />
beginning of a project and opportunities for improvement are<br />
highlighted. A future state VSM is also created to depict an<br />
idealized (future) process. Thereafter, front-line staff members<br />
generate ideas for improvement. The improvement team is<br />
expected to test their ideas using highly structured, rapid-change<br />
events called rapid process improvement workshops in which<br />
improvement ideas are expeditiously tested and implemented.<br />
Children’s Hospital and Regional Medical Center in Seattle,<br />
Washington, has been using lean methods for quality improve-<br />
ment in the operative setting since 2002. Adapting these methods<br />
to fit the health care (service) setting, these methods are called<br />
continuous performance improvement (CPI). The CPI philosophy<br />
is to focus on patients and families using quality, cost, delivery,<br />
safety, and engagement as metrics (Figure <strong>131</strong>–7). This philosophy<br />
highlights differences between traditional and lean quality improvement.<br />
First, it eliminates waste, complexity and variation to<br />
enhance quality and reduce cost rather than eliminate labor.<br />
Second, quality, cost, and cycle are addressed concurrently as<br />
related rather than as competing priorities. Finally, focus is on<br />
whole system rather than subsystem improvements.<br />
The initial 2 years were focused on point improvements within<br />
the operating rooms. However, during the last 3 years, attention<br />
has been focused on improvements in the operative services value<br />
stream using the full array of lean tools, e.g., Just in Time service<br />
and Built in Quality (Figure <strong>131</strong>–8). Just in Time is one pillar of the<br />
CPI management system. Simply put, Just in Time delivers the<br />
right items at the right time in the right amount. The power of Just<br />
in Time is that is allows staff to be responsive to the day-to-day<br />
shifts in customer demand. Products that move continuously<br />
through the processing steps with minimal waiting time in<br />
between and the shortest distance traveled will be produced with<br />
the highest efficiency. Sustaining continuous flow also serves to<br />
surface any problem that would inhibit that flow. In essence, the<br />
creation of flow forces the correction of problems, resulting in<br />
reduced waste. The other pillar is Built in Quality. This pillar<br />
requires making problems visible, never letting a defect pass along<br />
to the next step in the process, and stopping when there is a quality<br />
Figure <strong>131</strong>-6. Lean philosophy—5s levels of achievement.
CHAPTER <strong>131</strong> ■ Quality Improvement 2149<br />
Figure <strong>131</strong>-7. Continuous performance improvement (CPI)<br />
philosophy.<br />
problem. The key to developing effective mistake proofing lies in<br />
understanding how or why the mistake occurred.<br />
The quality of a system can be defined by five separate levels,<br />
as shown in Table <strong>131</strong>–3. The distinction between error and defect<br />
is important in this system. An error is, as the name implies, an<br />
error in the process at the point of creation. A defect is defined as<br />
an error that is passed on down to the next step in the process or<br />
ultimately to the customer. The highest level of quality is to<br />
prevent the occurrence of the error completely. If it is not possible<br />
to completely prevent the error, then try to detect the error as it<br />
occurs. In any case, it is important to prevent any defective items<br />
(or mistakes) from affecting the customer. “Continuous flow” and<br />
“pull” are fundamental elements that help us achieve Just in Time<br />
and Built in Quality. Continuous flow is producing and moving<br />
one item at a time through a series of steps, with each step making<br />
just what is requested by the next step; pull dictates when material<br />
is moved. Nothing is produced by the upstream supplier process<br />
until the downstream customer process signals a need, often via a<br />
Kanban card (used as a signaling system to trigger action), about<br />
what, when, and where it is needed. Toyota describes standardized<br />
work as a “foundation for kaizen (impro vement).” If the work is<br />
not standardized and it is different each time, there is “no basis<br />
for evaluation,” meaning no reference point from which to<br />
compare or improve.<br />
A degree of stability is needed in three areas before moving to<br />
standardized work: (1) The work task must be repeatable. If the<br />
work is described in “If, then” terms, it will not be possible to<br />
standardize unless these are just a few very simple rules. (2) The<br />
Figure <strong>131</strong>-8. Value stream improvement through waste<br />
reduction.<br />
line and equipment must be reliable and downtime should be<br />
minimal. It is not possible to standardize if the work is constantly<br />
interrupted and the person doing the work is sidetracked.<br />
(3) Quality issues must be minimal so that the person is not<br />
constantly correcting or struggling with poor quality.<br />
Over the last 5 years using CPI as the primary methodology for<br />
quality improvement, our institution has been able to achieve and<br />
sustain several important improvements in our operating rooms. A<br />
good example is the enhancement in admission process that has<br />
improved the quality (compliance) of the required preoperative<br />
documentation and reduced the admission work time such that we<br />
have decreased our scheduled arrival time before surgery to 75<br />
minutes, greatly improving patient and parental satisfaction.<br />
Failure Modes Effects Analysis<br />
Failure Modes and Effects Analysis (FMEA) was developed in the<br />
industrial setting and is now being used in health care to assess<br />
TABLE <strong>131</strong>-3. Toyota (“Lean”) Levels of Quality<br />
Quality Level Site of Action Classification<br />
1 Customer inspection Check for defects<br />
2 Company inspection<br />
3 Unit inspection<br />
4 Self-inspection Detect errors<br />
5 Mistake proof Prevent errors
2150 PART 6 ■ Specific Considerations<br />
risk of failure and harm in processes and to identify the most<br />
important areas for process improvements. Teams use FMEA to<br />
evaluate processes for possible failures and to prevent them by<br />
correcting the processes proactively rather than reacting to adverse<br />
events after failures have occurred. This emphasis on prevention<br />
may reduce risk of harm to both patients and staff. FMEA is<br />
particularly useful in evaluating a new process before implementation<br />
and in assessing the impact of a proposed change to an<br />
existing process. FMEA includes review of the following:<br />
●<br />
●<br />
●<br />
●<br />
Steps in the process<br />
Failure modes (What could go wrong?)<br />
Failure causes (Why would the failure happen?)<br />
Failure effects (What would be the consequences of each<br />
failure?)<br />
FMEA identifies the opportunities for failure, or “failure<br />
modes,” in each step of the process. Each failure mode gets a<br />
numeric score that quantifies (1) likelihood that the failure will<br />
occur, (2) likelihood that the failure will be detected, and (3) the<br />
amount of harm or damage the failure mode may cause to a person<br />
or to equipment. The product of these three scores is the risk<br />
priority number (RPN) for that failure mode. The sum of the RPNs<br />
for the failure modes is the overall RPN for the process. As an<br />
organization works to improve a process, it can anticipate and<br />
compare the effects of proposed changes by calculating hypothetical<br />
RPNs of different scenarios. The FMEA can be used in two<br />
separate but related ways. Teams can use FMEA to discuss and<br />
analyze the steps of a process, consider changes, and calculate the<br />
RPN of changes under consideration. They can use FMEA to<br />
“verbally simulate” a change and evaluate its expected impact in a<br />
safe environment, before testing it in a patient care area. Some<br />
ideas that seem like great improvements can turn out to be changes<br />
that would actually increase the estimated RPN of the process. In<br />
addition to using FMEA to help evaluate the impact of changes<br />
under consideration, teams can calculate the total RPN for a<br />
process and then track the RPN over time to see whether changes<br />
being made to the process are leading to improvement. Numerous<br />
online resources are available to assist teams with FMEA. 44<br />
CASE DISCUSSION<br />
Everyone can remember the horror of presenting at old style<br />
QA/QI rounds, where ABC meant “Accuse, Blame, and Criticize”—<br />
and you were the one who would be blamed. If we are to learn from<br />
our near misses, we must conduct our analysis in a way that it is<br />
nonpunitive and where voluntary, anonymous reporting is not only<br />
possible, but is encouraged. NASA and the airline industry have<br />
had such anonymous, voluntary systems in place for some time. 45<br />
Recently, a framework for analyzing the root causes of adverse<br />
events and for looking at the barriers that are available to prevent<br />
the error from reaching the patient was described by one of the<br />
authors. 6 This framework has been helpful in our departmental<br />
QA/QI discus sions to steer the discussion away from individual<br />
blame. We be lieve that voluntary reporting is more likely to occur<br />
in a situation where we always look for something to fix, not<br />
someone to blame.<br />
The following case was described by an anesthesiolgy trainee.<br />
“I was asked to help out with a hepatocarcinoma resection. I came in<br />
around 7:15 pm and the Attending anesthesiologist and I decided to<br />
switch to isoflurane for maintenance, as the case was likely to be<br />
prolonged. Desflurane and sevoflurane vaporizers were in position on<br />
the machine, with the sevoflurane vaporizer in use. I replaced the<br />
desflurane vaporizer with an isoflurane vaporizer: I locked it and<br />
turned on the agent.<br />
Ten to 15 minutes later, there was an episode of hypotension that<br />
required resuscitation with blood products and vasopressors. I turned<br />
down the vaporizer setting to an Fi isoflurane 0.4% to maintain some<br />
anesthesia. There was ongoing massive transfusion of blood products<br />
throughout this time. The end tidal agent analyzer read 0.7% and<br />
then 0.5% over next thirty minutes.<br />
I was then asked to leave the room and do another case and came<br />
back an hour later to help out. It was noted that the end tidal agent<br />
analyzer was not registering any agent, although the vaporizer was<br />
still switched on at about 0.4%. The Attending and resident had<br />
taken off the circuit briefly to see if they could smell agent and both<br />
had thought that they could and so attributed the reading of zero<br />
end-tidal agent to an analyzer error. Finally at around 20:45 pm it<br />
was noted that the isoflurane canister was not seated properly on the<br />
machine (despite the locking mechanism in the “locked” position)<br />
and so the end-tidal agent reading of zero was real. We reseated the<br />
canister, gave the patient 4 mg of midazolam for its amnestic effects,<br />
informed the surgeons, and continued with ongoing resuscitation<br />
with low level end-tidal agent for amnesia. The case ended at around<br />
3:00 am. He has not yet reported anything suggestive of awareness,<br />
but we are continuing to visit him to ask about this possibility.<br />
How do you prevent this from happening in the future? More<br />
vigilance of course, but that’s easier said than done. Perhaps a<br />
different locking mechanism design on the vaporizer? Is it possible to<br />
have an alarm system on the vaporizer if it is improperly seated?<br />
Mostly it was my fault and not a device error. I take full<br />
responsibility.”<br />
Here is the response from one of the authors (SR) in her role as<br />
QA/QI director for our department.<br />
“Errors are rarely the fault of an individual and much more often<br />
due to a combination of factors. Here is a template that I often use<br />
for analyzing errors.” 6<br />
Catalyst event—your patient developed hepatocarcinoma and<br />
needed surgery, thereby putting him in harm’s way.<br />
System faults—we have machines that can’t accommodate<br />
3 vaporizers, so you have to swap them out as needed. Our<br />
vaporizers do not alarm or refuse to switch on if they are not fully<br />
locked. The OR was busy and you were shuttled between cases,<br />
unable to give your full attention to a difficult case.<br />
Loss of situational awareness—the OR team noted the zero end-tidal<br />
agent, but dismissed it as an analyzer error because they were task<br />
overloaded due to the ongoing resuscitation. I notice the times on<br />
the incident were well into the evening, so there were some<br />
fatigued members of the OR team, this also contributes to loss of<br />
situational awareness.<br />
Human Error—the vaporizer was not locked in position correctly, no<br />
one noticed and acted upon the reading of zero end-tidal agent.<br />
Barriers for safety that can potentially trap and mitigate an error<br />
are:-<br />
Technology—technology did help you in that there was a reading of<br />
zero end-tidal agent but there were technology failures in that the<br />
improperly seated vaporizer was not flagged as a problem by our<br />
existing technology. At the time of the incident, the analyzer was<br />
set to sevoflurane, not to automatic and so it was not “looking” for
CHAPTER <strong>131</strong> ■ Quality Improvement 2151<br />
isoflurane. This made it easy to dismiss the zero end-tidal<br />
agent reading as an analyzer error and not real, because end-tidal<br />
agent readings and vaporizer settings had not matched earlier<br />
in the case, so you did not trust that your technology was<br />
working.<br />
Proficiency—other than delay in acting upon the low end-tidal agent,<br />
I see no proficiency failures here—everyone worked hard to save<br />
a critically ill patient.<br />
Standard Operating Procedures (SOP)—perhaps we need a SOP for<br />
changing a vaporizer—perhaps we should set mandatory checks<br />
on end-tidal agent for the next hour after any change of vaporizer<br />
to make sure subtle (and not so subtle) problems are not missed.<br />
In addition, we need to schedule these cases such that one team is<br />
able to give their full attention to the case, with additional<br />
dedicated help as needed.<br />
Judgment—I see no judgment lapses here and you have<br />
demonstrated good judgment in your handling of the situation<br />
since the problem was recognized.<br />
I would suggest:<br />
1. Please stop beating yourself up (easier said than done).<br />
2. Continue to visit your patient and if your patient has<br />
awareness—you and your Attending should discuss with<br />
risk management and arrange follow up for the patient.<br />
3. Yes, we will discuss this case at the next QA/QI conference,<br />
but I would like to put it in the sort of framework described<br />
above, rather than the “mea culpa” version.<br />
This can be used as valuable teaching moment for our<br />
department and I thank you for having the courage to disclose<br />
it and for the professional way in which you have handled it<br />
so far.”<br />
In follow-up, the patient did have a brief episode of awareness,<br />
but no pain and was not distressed about it. The vaporizer<br />
problem was reported to the Food and Drug Administration’s<br />
Medwatch. 46<br />
HISTORY AND EVOLUTION<br />
OF ERROR MODELS<br />
Historically, adverse outcomes are often viewed as each separate<br />
event being the links in a chain, which lead to an accident.<br />
Supposedly, breaking any of the links prevents the error from<br />
reaching the patient. This may be a flawed way of analyzing<br />
accidents, since each link contributes to the outcome, but breaking<br />
a link does not necessarily stop or prevent the accident.<br />
Another popular illustration of errors is the Swiss cheese model<br />
(Figure <strong>131</strong>–9). In this model, various barriers exist that attempt<br />
to trap an error and to prevent it from causing harm. Only if all of<br />
the holes in the various barriers line up does the error get through.<br />
However, this model is also limited. One problem is that, in theory,<br />
there must be an infinite number of barriers to trap all errors.<br />
(Robert Caplan MD, personal communication, 2004) Also, where<br />
does the error come from, and where does it go when it is stopped?<br />
What is missing from all these models is the element of time and<br />
the dynamic nature of these situations.<br />
This reverse Volant diagram (Figure <strong>131</strong>–10) illustrates a global<br />
view of a situation. Red indicates a critical situation; yellow/amber<br />
indicates a situation that is not perfect but may be good enough to<br />
allow the team to stabilize the situation and to think about how<br />
Figure <strong>131</strong>-9. Swiss cheese model.<br />
best to resolve the problem; green indicates an optimum situation<br />
with all systems functioning as intended. If a catastrophic (red)<br />
situation arises, our tendency is to want to go back to green quickly.<br />
An example of this in practice is the unanticipated difficult airway.<br />
Faced with a patient who is difficult to intubate, our tendency is to<br />
Figure <strong>131</strong>-10. Reverse Volant diagram.
2152 PART 6 ■ Specific Considerations<br />
want to try to accomplish that task, especially if we did not expect<br />
it to be difficult. We want to be back in the green, and we hope no<br />
one will notice. However, repeated attempts to intubate the patient<br />
may worsen the situation, resulting in the feared combination<br />
of cannot intubate/cannot ventilate. The American Society of<br />
Anesthesiologists (ASA) guidelines for difficult airway manage -<br />
ment 47 do not recommend repeated tracheal intubation attempts,<br />
and yet we still have a tendency to persist in this path. A much<br />
safer path is to return to mask ventilation or to place a laryngeal<br />
mask airway, an amber/yellow situation. This buys thinking time,<br />
so that additional technology may be brought in (difficult airway<br />
equipment), additional proficiency may be added (more/different<br />
personnel), the American Society of Anesthesiologists guidelines<br />
can be referred to (standard operating procedure), and the<br />
judgment of the individual trying to intubate the patient can be<br />
enhanced by using the collective wisdom of those around him.<br />
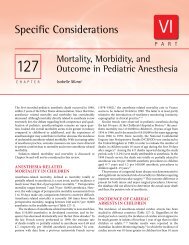
TWO-DIMENSIONAL ERROR MODEL<br />
It is possible to combine the color progression of the Volant diagram<br />
together with the idea of barriers from the Swiss cheese diagram.<br />
The barriers are technology, proficiency, standard operating<br />
procedure, and judgment. Adding the element of time creates a<br />
dynamic component to the model. (Figures 130–11 to 130–14)<br />
The yellow ball represents an error that is rolling toward the<br />
patient, with potential for harm. (Figure <strong>131</strong>–11). Notice how the<br />
error (the ball) increases in size as it moves from left to right,<br />
representing the increasing momentum of the error, as barriers<br />
fail to stop it. The error also changes color from green to yellow to<br />
amber to red as it moves from left to right, indicating greater<br />
potential for harm as it moves closer to the patient (Figure <strong>131</strong>–<br />
11). In the second diagram (Figure <strong>131</strong>–12), the axis is tilted; this<br />
represents a change in the underlying condition of the patient. If<br />
the first diagram was an ASA 1 patient, this diagram could<br />
represent an ASA 3 patient. The tilt of the slope means that the<br />
error gains momentum more easily than in the first situation and<br />
so the potential to reach the patient is greater; in other words, this<br />
patient has less physiologic reserve. In the third diagram, this same<br />
Figure <strong>131</strong>-12. Snapshot of dynamic error model: tilted axis.<br />
With permission from Capt. Carlyle Rampersad.<br />
ASA 3 patient is protected from harm because the judgment<br />
barrier is raised and this traps the error (Figure <strong>131</strong>–13). In the<br />
final diagram, the judgment barrier is raised further, reversing the<br />
ball and restoring the situation partially toward normal (Figure<br />
<strong>131</strong>–14). We do this every day, perhaps without realizing it,<br />
monitoring sicker patients more closely, assigning the patient to<br />
appropriately skilled personnel, and using standard guidelines<br />
where these exist. In the case discussed above the slope of the axis<br />
of the model was tilted due to the patient’s underlying condition<br />
(hepatocarcinoma) and also the time of day (resulting in fatigued<br />
medical providers). Raising a high standard operating procedure<br />
barrier could potentially have trapped the error of misaligning the<br />
vaporizer before it reached the patient, and the awareness could<br />
have been prevented if the vaporizer problem had been detected<br />
and corrected sooner.<br />
Figure <strong>131</strong>-11. Snapshot of dynamic error model: healthy<br />
patient. With permission from Capt. Carlyle Rampersad.<br />
Figure <strong>131</strong>-13. Snapshot of dynamic error model: error trapped<br />
by judgment. With permission from Capt. Carlyle Rampersad.
CHAPTER <strong>131</strong> ■ Quality Improvement 2153<br />
Figure <strong>131</strong>-14. Snapshot of dynamic error model: error<br />
reversed by judgment. With permission from Capt. Carlyle<br />
Rampersad.<br />
CONCLUSIONS<br />
Samuel Beckett wrote “Ever tried. Ever failed. No matter. Try Again.<br />
Fail again. Fail better.” When considering quality improvement,<br />
it is important that we also consider how it is to be measured.<br />
Recent editorials and commentaries have made the point that the<br />
traditional scientific method, in which the primary goal is to<br />
discover and disseminate new knowledge, is not well suited to the<br />
measurement of quality improvement. 48–50 In our world, where<br />
evidence-based medicine is highly valued and the randomized<br />
controlled trial is the pinnacle of all studies, descriptive studies of<br />
quality improvement efforts that utilize local knowledge may be<br />
overlooked by editors in favor of more “scientific” research. It will<br />
be important to be sure that managers and administrators in<br />
healthcare understand the iterative nature of quality improvement.<br />
In addition, if we are to be successful in QA/QI efforts, websites<br />
that allow the integration of data from several sources will be<br />
essential and our work needs to be transparent and widely<br />
reported, so many may benefit from the lessons to be learned.<br />
REFERENCES<br />
1. Committee on Quality Health Care in America, Institute of Medicine.<br />
Crossing the Quality Chasm: A New Health System for the 21st Century.<br />
Washington, DC: National Academy Press; 2001.<br />
2. Barclay L. ABO incompatibility in heart-lung transplant: an expert interview<br />
with Robert A. Metzger, MD. Medscape Med News. 2003. Available<br />
at: http://www.medscape.com/viewarticle/449763. Accessed January 13,<br />
2009.<br />
3. Kohn LT, Corrigan JM, Donaldson MS, eds. To Err is Human: Building a<br />
Safer Health System. Washington, DC: National Academy Press; 2000.<br />
4. National Committee for Quality Assurance. The State of Health Care<br />
Quality: 2004. Available at: http://www.ncqa.org/tabid/313/Default.aspx.<br />
Accessed January 13, 2009.<br />
5. Merriam-Webster Online Dictionary. Available at: http:www.m-w.com.<br />
Accessed January 13, 2009.<br />
6. Rampersad CJ, Rampersad SE. Can medicine really learn anything from<br />
aviation? Or are patients and their disease processes too complex? Semin<br />
Anesth Perioperative Med Pain. 2007;26:158–166.<br />
7. Thomas KB. The Clover/Snow Collection. Anaesthesia. 1972;27:436–449.<br />
8. Snow J. On Chloroform and Other Anaesthetics: Their Action and<br />
Administration. London: JA Churchill Ltd; 1858.<br />
9. Vinten-Johansen P. The John Snow Archive and Research Companion.<br />
Detroit, MI: Michigan State University. Available at: http://johnsnow.<br />
matrix.msu.edu/index.php.<br />
10. Beecher HK, Todd DP. A study of the deaths associated with anesthesia<br />
and surgery: based on a study of 599,548 anesthesias in ten institutions<br />
1948–1952, inclusive. Ann Surg. 1954;140(1):2–34.<br />
11. Buck N, Devlin HB, Lunn JN. Report of the Confidential Enquiry into<br />
Peripoperative Deaths. London: Nuffield Provincial Hospitals Trust and<br />
King’s Fund for Hospitals; 1987.<br />
12. Lunn JN, Devlin HB. Lessons from the confidential enquiry into<br />
perioperative deaths in three NHS regions. Lancet. 1987;2:1384–1386.<br />
13. Webb RK, Currie M, Morgan CA, et al. The Australian Incident<br />
Monitoring Study: an analysis of 2000 incident reports. Anaesth Intensive<br />
Care. 1993;21(5):520–528.<br />
14. Cooper JB. Is voluntary reporting of critical events effective for quality<br />
assurance? Anesthesiology. 1996;85(5):961–964.<br />
15. Sanborn KV, Castro J, Kuroda M, et al. Detection of intraoperative<br />
incidents by electronic scanning of computerized anesthesia<br />
records: comparison with voluntary reporting. Anesthesiology. 1996;85:<br />
977–987.<br />
16. Cullen DJ, Bates DW, Small SD, et al. The incident reporting system does<br />
not detect adverse drug events: a problem for quality improvement. Joint<br />
Commission J Quality Improvement. 1995;21:541–548.<br />
17. Flanagan JC. The critical incident technique. Psychol Bull. 1954;51:327–358.<br />
18. Cooper JB, Newbower RS, Long CD, et al. Preventable anaesthesia<br />
mishaps: a study of human factors. Anesthesiology. 1978;49:399–406.<br />
19. Morray JP, Geiduschek JM, Caplan RA, et al. A comparison of pediatric<br />
and adult anesthesia closed malpractice claims. Anesthesiology. 1993;<br />
78(3):461–467.<br />
20. Keenan RL, Shapiro, JH, Kane FR, et al. Bradycardia during anesthesia in<br />
infants: an epidemiologic study. Anesthesiology. 1994;80:976–982.<br />
21. Rackow H, Salinitre E, Green L. Frequency of cardiac arrest associated<br />
with anesthesia in infants and children. Pediatrics. 1961;28:<br />
697–704.<br />
22. Ollson G, Hallen B. Cardiac arrest during anaesthesia: a computerized<br />
study in 250,543 anaesthetics. Acta Anaesth Scand. 1988;32:653–664.<br />
23. Tiret L, Nivoche Y, Hatton F, et al. Complications related to anaesthesia in<br />
infants and children. Br J Anaesth. 1988;61:263–269.<br />
24. Cohen M, Cameron C, Duncan P. Pediatric anesthetic morbidity and<br />
mortality in the perioperative period. Anesth Analg. 1990;70:160–167.<br />
25. Morray JP, Geiduschek JM, Ramamoorthy C, et al. Anesthesia-related<br />
cardiac arrest in children. Anesthesiology. 2000;93:6–14.<br />
26. Bhananker SM, Ramamoorthy C, Geiduschek JM, et al. Anesthesiarelated<br />
cardiac arrest in children: update from the pediatric perioperative<br />
cardiac arrest registry. Anesth Analg. 2007;105(2):344–50.<br />
27. Rampersad SE, Lynn AM. Pediatric patient selection and provider issues.<br />
J Ambulatory Surg. 2005;12:15–18.<br />
28. Hackel A. Training and practice of pediatric anesthesia. In: Gregory<br />
G, editor. Pediatric Anesthesia. 4th ed. New York: WB Saunders; 2001.<br />
p. 15.<br />
29. Hackel A, Badgwell JM, Binding RR, et al. Guidelines for the pediatric<br />
perioperative environment. American Academy of Pediatrics, Section on<br />
Anesthesiology. Pediatrics. 1999;103:512–515.<br />
30. Royal College of Anaesthetists. Guidelines for the Provision of Anaesthetic<br />
Services. <strong>Chapter</strong> 8: Guidance on the provision of paediatric<br />
anaesthesia services. 2004, revised April 22, 2010. Available at: http://<br />
www.rcoa.ac.uk/docs/GPAS-Paeds.pdf. Accessed April 23, 2009.<br />
31. The National Confidential Enquiry into Patient Outcome and Death<br />
(NCEPOD). Extremes of Age: Data from 1997/1998 Anaesthetic<br />
Questionnaires—Children. London: NCEPOD; 1999. Available at: http://<br />
www.ncepod.org.uk/pdf/1999/99sup1.pdf. Accessed January 13, 2009.<br />
32. NCEPOD. Summary of the 1989 Report. London: NCEPOD; 1990.<br />
Available at: http://www.ncepod.org.uk/pdf/1989/1989sum.pdf. Accessed<br />
January 13, 2009.<br />
33. California Society of Anesthesiologists Policy on Pediatric Anesthesia.<br />
Bull Calif Soc Pediatr Anesth. 2003:33–35. Available at: http://www.csahq.<br />
org/pdf/alerts/csapedpolicy.pdf. Accessed January 13, 2009.<br />
34. Society for Pediatric Anesthesia. Policy Statement on Provision of<br />
Pediatric Anesthesia Care. Available at: http://www.pedsanesthesia.org/<br />
policyprovision.iphtml. Accessed January 13, 2009.<br />
35. Arul GS, Spicer RG. Where should paediatric surgery be performed? Arch<br />
Dis Child. 1998;79:65–72.
2154 PART 6 ■ Specific Considerations<br />
36. Donabedian A. The quality of care: how can it be assessed? Arch Pathol<br />
Lab Med. 1997:121;1145–50.<br />
37. The Leapfrog Group. The Leapfrog Group Fact Sheet. Available at:<br />
http://www.leapfroggroup.org/about_us/leapfrog-factsheet. Accessed<br />
January 13, 2009.<br />
38. Berwick DM. Continuous improvement as an ideal in health care. N Engl<br />
J Med. 1989:320;53–6.<br />
39. Berwick DM. Developing and testing changes in delivery of care. Ann<br />
Intern Med. 1998:128;53–6.<br />
40. Chassin MR. Is health care ready for Six Sigma quality? Milbank Q.<br />
1998:76;565–591.<br />
41. Welch J. Jack: Straight from the Gut. Warner Books, New York; 2001.<br />
pp. 329–330.<br />
42. Ohno T. Toyota Production System: Beyond Large Scale Production.<br />
Portland: Productivity Press; 1998.<br />
43. Womack JP, Jones DT. Lean Thinking. New York: Simon and Schuster; 1996.<br />
44. Institute for Health Care Improvement. Failure Mode and Effect Analysis<br />
Information Centre. Available at: http://www.ihi.org/ihi/workspace/<br />
tools/fmea. Accessed January 13, 2009.<br />
45. NASA Safety and Hazard Reporting. Available at: http://www.nasa.gov/<br />
audience/safety/reporting/Safety_reporting.html. Accessed January 13,<br />
2009.<br />
46. US Food and Drug Administration. MedWatch: The FDA Safety and<br />
Adverse Event Reporting Program. Available at: http://www.fda.gov/<br />
Safety/MedWatch/default.htm. Accessed January 13, 2009.<br />
47. Practice guidelines for management of the difficult airway: an updated<br />
report by the American Society of Anesthesiologists Task Force<br />
on Management of the Difficult Airway. Anesthesiology. 2003;98:<br />
1269–1277.<br />
48. Berwick DM. Broadening the view of evidence-based medicine. Qual Saf<br />
Health Care. 2005;14:315–316.<br />
49. Thomson RG. Consensus publication guidelines: the next step in<br />
the science of quality improvement? Qual Saf Health Care. 2005;14:<br />
317–318.<br />
50. Davidoff F, Batalden P. Toward stronger evidence on quality improvement.<br />
Draft publication guidelines: the beginning of a consensus project.<br />
Qual Saf Health Care. 2005;14:319–325.