

Car Ownership? Evidence from the Copenhagen Metropolitan Area
n?u=RePEc:tin:wpaper:20150139&r=dem
n?u=RePEc:tin:wpaper:20150139&r=dem

You also want an ePaper? Increase the reach of your titles
YUMPU automatically turns print PDFs into web optimized ePapers that Google loves.
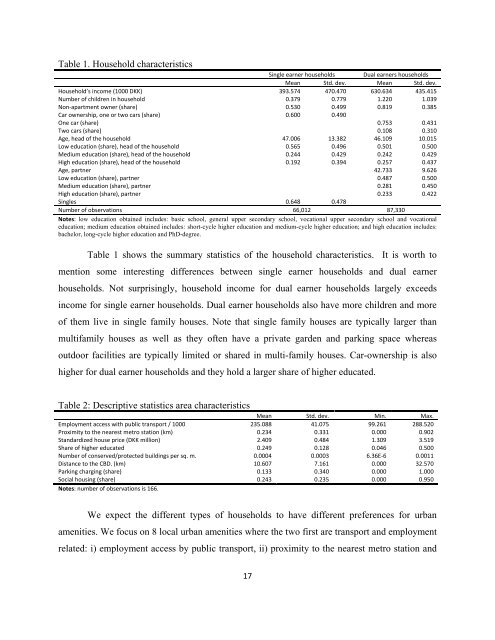
Table 1. Household characteristics<br />
Single earner households Dual earners households<br />
Mean Std. dev. Mean Std. dev.<br />
Household’s income (1000 DKK) 393.574 470.470 630.634 435.415<br />
Number of children in household 0.379 0.779 1.220 1.039<br />
Non‐apartment owner (share) 0.530 0.499 0.819 0.385<br />
<strong>Car</strong> ownership, one or two cars (share) 0.600 0.490<br />
One car (share) 0.753 0.431<br />
Two cars (share) 0.108 0.310<br />
Age, head of <strong>the</strong> household 47.006 13.382 46.109 10.015<br />
Low education (share), head of <strong>the</strong> household 0.565 0.496 0.501 0.500<br />
Medium education (share), head of <strong>the</strong> household 0.244 0.429 0.242 0.429<br />
High education (share), head of <strong>the</strong> household 0.192 0.394 0.257 0.437<br />
Age, partner 42.733 9.626<br />
Low education (share), partner 0.487 0.500<br />
Medium education (share), partner 0.281 0.450<br />
High education (share), partner 0.233 0.422<br />
Singles 0.648 0.478<br />
Number of observations 66,012 87,330<br />
Notes: low education obtained includes: basic school, general upper secondary school, vocational upper secondary school and vocational<br />
education; medium education obtained includes: short-cycle higher education and medium-cycle higher education; and high education includes:<br />
bachelor, long-cycle higher education and PhD-degree.<br />
Table 1 shows <strong>the</strong> summary statistics of <strong>the</strong> household characteristics. It is worth to<br />
mention some interesting differences between single earner households and dual earner<br />
households. Not surprisingly, household income for dual earner households largely exceeds<br />
income for single earner households. Dual earner households also have more children and more<br />
of <strong>the</strong>m live in single family houses. Note that single family houses are typically larger than<br />
multifamily houses as well as <strong>the</strong>y often have a private garden and parking space whereas<br />
outdoor facilities are typically limited or shared in multi-family houses. <strong>Car</strong>-ownership is also<br />
higher for dual earner households and <strong>the</strong>y hold a larger share of higher educated.<br />
Table 2: Descriptive statistics area characteristics<br />
Mean Std. dev. Min. Max.<br />
Employment access with public transport / 1000 235.088 41.075 99.261 288.520<br />
Proximity to <strong>the</strong> nearest metro station (km) 0.234 0.331 0.000 0.902<br />
Standardized house price (DKK million) 2.409 0.484 1.309 3.519<br />
Share of higher educated 0.249 0.128 0.046 0.500<br />
Number of conserved/protected buildings per sq. m. 0.0004 0.0003 6.36E‐6 0.0011<br />
Distance to <strong>the</strong> CBD. (km) 10.607 7.161 0.000 32.570<br />
Parking charging (share) 0.133 0.340 0.000 1.000<br />
Social housing (share) 0.243 0.235 0.000 0.950<br />
Notes: number of observations is 166.<br />
We expect <strong>the</strong> different types of households to have different preferences for urban<br />
amenities. We focus on 8 local urban amenities where <strong>the</strong> two first are transport and employment<br />
related: i) employment access by public transport, ii) proximity to <strong>the</strong> nearest metro station and<br />
17