

Car Ownership? Evidence from the Copenhagen Metropolitan Area
n?u=RePEc:tin:wpaper:20150139&r=dem
n?u=RePEc:tin:wpaper:20150139&r=dem

Create successful ePaper yourself
Turn your PDF publications into a flip-book with our unique Google optimized e-Paper software.
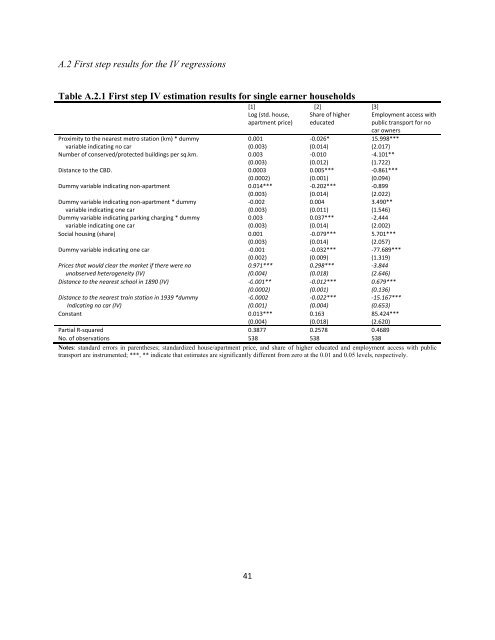
A.2 First step results for <strong>the</strong> IV regressions<br />
Table A.2.1 First step IV estimation results for single earner households<br />
[1] [2] [3]<br />
Log (std. house,<br />
apartment price)<br />
Share of higher<br />
educated<br />
Employment access with<br />
public transport for no<br />
car owners<br />
Proximity to <strong>the</strong> nearest metro station (km) * dummy<br />
variable indicating no car<br />
0.001<br />
(0.003)<br />
‐0.026*<br />
(0.014)<br />
15.998***<br />
(2.017)<br />
Number of conserved/protected buildings per sq.km. 0.003<br />
(0.003)<br />
‐0.010<br />
(0.012)<br />
‐4.101**<br />
(1.722)<br />
Distance to <strong>the</strong> CBD. 0.0003<br />
(0.0002)<br />
0.005***<br />
(0.001)<br />
‐0.861***<br />
(0.094)<br />
Dummy variable indicating non‐apartment 0.014***<br />
(0.003)<br />
‐0.202***<br />
(0.014)<br />
‐0.899<br />
(2.022)<br />
Dummy variable indicating non‐apartment * dummy<br />
variable indicating one car<br />
‐0.002<br />
(0.003)<br />
0.004<br />
(0.011)<br />
3.490**<br />
(1.546)<br />
Dummy variable indicating parking charging * dummy<br />
variable indicating one car<br />
0.003<br />
(0.003)<br />
0.037***<br />
(0.014)<br />
‐2.444<br />
(2.002)<br />
Social housing (share) 0.001<br />
(0.003)<br />
‐0.079***<br />
(0.014)<br />
5.701***<br />
(2.057)<br />
Dummy variable indicating one car ‐0.001<br />
(0.002)<br />
‐0.032***<br />
(0.009)<br />
‐77.689***<br />
(1.319)<br />
Prices that would clear <strong>the</strong> market if <strong>the</strong>re were no<br />
unobserved heterogeneity (IV)<br />
0.971***<br />
(0.004)<br />
0.298***<br />
(0.018)<br />
‐3.844<br />
(2.646)<br />
Distance to <strong>the</strong> nearest school in 1890 (IV) ‐0.001**<br />
(0.0002)<br />
‐0.012***<br />
(0.001)<br />
0.679***<br />
(0.136)<br />
Distance to <strong>the</strong> nearest train station in 1939 *dummy<br />
Indicating no car (IV)<br />
‐0.0002<br />
(0.001)<br />
‐0.022***<br />
(0.004)<br />
‐15.167***<br />
(0.653)<br />
Constant 0.013***<br />
(0.004)<br />
0.163<br />
(0.018)<br />
85.424***<br />
(2.620)<br />
Partial R‐squared 0.3877 0.2578 0.4689<br />
No. of observations 538 538 538<br />
Notes: standard errors in paren<strong>the</strong>ses; standardized house/apartment price, and share of higher educated and employment access with public<br />
transport are instrumented; ***, ** indicate that estimates are significantly different <strong>from</strong> zero at <strong>the</strong> 0.01 and 0.05 levels, respectively.<br />
41