Lima - Perú 2015
Mapa_de_Vulnerabilidad_Peru_2015
Mapa_de_Vulnerabilidad_Peru_2015

Create successful ePaper yourself
Turn your PDF publications into a flip-book with our unique Google optimized e-Paper software.
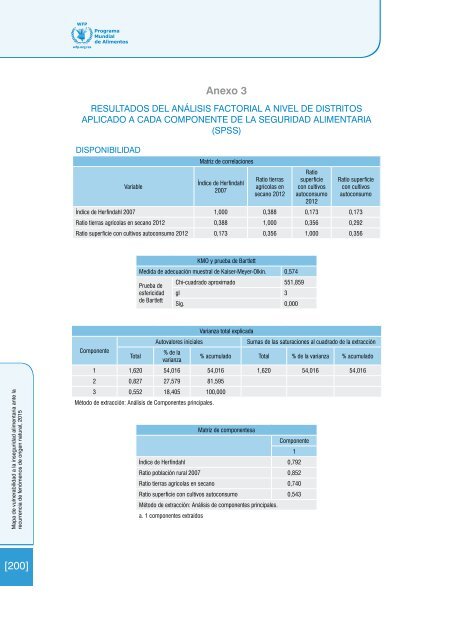
Anexo 3<br />
RESULTADOS DEL ANÁLISIS FACTORIAL A NIVEL DE DISTRITOS<br />
APLICADO A CADA COMPONENTE DE LA SEGURIDAD ALIMENTARIA<br />
(SPSS)<br />
DISPONIBILIDAD<br />
Variable<br />
Matriz de correlaciones<br />
Índice de Herfindahl<br />
2007<br />
Ratio tierras<br />
agrícolas en<br />
secano 2012<br />
Ratio<br />
superficie<br />
con cultivos<br />
autoconsumo<br />
2012<br />
Ratio superficie<br />
con cultivos<br />
autoconsumo<br />
Índice de Herfindahl 2007 1,000 0,388 0,173 0,173<br />
Ratio tierras agrícolas en secano 2012 0,388 1,000 0,356 0,292<br />
Ratio superficie con cultivos autoconsumo 2012 0,173 0,356 1,000 0,356<br />
KMO y prueba de Bartlett<br />
Medida de adecuación muestral de Kaiser-Meyer-Olkin. 0,574<br />
Prueba de<br />
Chi-cuadrado aproximado 551,859<br />
esfericidad gl 3<br />
de Bartlett<br />
Sig. 0,000<br />
Mapa de vulnerabilidad a la inseguridad alimentaria ante la<br />
recurrencia de fenómenos de origen natural, <strong>2015</strong><br />
Varianza total explicada<br />
Autovalores iniciales<br />
Sumas de las saturaciones al cuadrado de la extracción<br />
Componente<br />
% de la<br />
Total<br />
varianza<br />
% acumulado Total % de la varianza % acumulado<br />
1 1,620 54,016 54,016 1,620 54,016 54,016<br />
2 0,827 27,579 81,595<br />
3 0,552 18,405 100,000<br />
Método de extracción: Análisis de Componentes principales.<br />
Matriz de componentesa<br />
Componente<br />
1<br />
Índice de Herfindahl 0,792<br />
Ratio población rural 2007 0,852<br />
Ratio tierras agrícolas en secano 0,740<br />
Ratio superficie con cultivos autoconsumo 0,543<br />
Método de extracción: Análisis de componentes principales.<br />
a. 1 componentes extraídos<br />
[200]