- Page 1 and 2:
Getting Started with MATLAB Updated
- Page 3 and 4:
Getting Started with MATLAB A Quick
- Page 5:
To Ma Gayatri and my parents Shri C
- Page 8 and 9:
viii Contents 3 Interactive Computa
- Page 10 and 11:
X Contents 6.3 3-D Plots . . . . .
- Page 12 and 13:
Preface I enjoy MATLAB, and I want
- Page 14 and 15:
xiv Preface Acknowledgments I was h
- Page 16 and 17:
2 Introduction MATLAB 0 Graphics
- Page 18 and 19:
4 lntrod uctiun -- 1.4 Where Do I G
- Page 20 and 21:
6 Introduction MATLAB prompt. In MA
- Page 22 and 23:
8 Introduction MATLAB Desktop ! Cur
- Page 24 and 25:
10 Introduction commands from even
- Page 26 and 27:
12 Introduction 1.6.6 General comma
- Page 28 and 29:
c;,\e \"', t sfmpl TPBYUl§l CC
- Page 30 and 31:
16 Tutorial Lessons The Basics Here
- Page 32 and 33:
18 Tutorial Lessons » 2 + 2 ans 4
- Page 34 and 35:
20 Tutorial Lessons Answers to Exer
- Page 36 and 37:
22 Tutorial Lessons >> X [1 2 3} x
- Page 38 and 39:
24 Tutorial Lessons Answers to Exer
- Page 40 and 41:
26 Tutorial Lessons » theta. ""·
- Page 42 and 43:
28 Tutorial Lessons Answers to Exer
- Page 44 and 45:
30 Tutorial Lessons 3. Write and sa
- Page 46 and 47:
32 Tutorial Lessons Answers to Exer
- Page 48 and 49:
34 Tutorial Lessons 3. Now write an
- Page 50 and 51:
36 Tutorial Lessons Answers to Exer
- Page 52 and 53:
38 Tutorial Lessons -- Directional
- Page 54 and 55:
40 Tutorial Lessons » A= [l 2 3; 4
- Page 56 and 57:
42 Tutorial Lessons EXERCISES 1. En
- Page 58 and 59:
44 Tutorial Lessons >> f @(x) xA3 -
- Page 60 and 61:
46 Tutorial Lessons EXERCISES 1. Cr
- Page 62 and 63:
48 Tutorial Lessons >> syms x y >>
- Page 64 and 65:
50 Tutorial Lessons EXERCISES 1. So
- Page 66 and 67:
52 Tutorial Lessons >> clear al l >
- Page 68 and 69:
54 Tutorial Lesson; EXERCISES 1. Wo
- Page 70 and 71:
56 Tutorial Lessons >> pwd Print (s
- Page 72 and 73:
58 Tutorial Lessons 2.11 Lesson 11:
- Page 74 and 75:
60 Tutorial Lessons EXERCISES 1. Us
- Page 77 and 78:
Interactive • Computation In prin
- Page 79 and 80:
3.1 Matrices and Vectors 65 3.1 Mat
- Page 81 and 82:
3.1 Matrices and Vectors 67 »A ran
- Page 83 and 84:
3.1 Matrices and Vectors 69 Transpo
- Page 85 and 86:
3.1 Matrices and Vectors 71 » eye
- Page 87 and 88:
3.2 Matrix and Array Operations 73
- Page 89 and 90:
3.2 Matrix and Array Operations 75
- Page 91 and 92:
3.3 Character strings 77 Round-off
- Page 93 and 94:
3.3 Character strings 79 howdy = ['
- Page 95 and 96:
3 .4 A Special Note on Array Operat
- Page 97 and 98:
3.5 Command-Line Functions 83 3.5 C
- Page 99 and 100:
3.6 Using Built-in Functions and On
- Page 101 and 102:
3.6 Using Built-in Functions and On
- Page 103 and 104:
3.6 Using Built-in Functions and On
- Page 105 and 106:
3. 7 Saving and Loading Data 91 You
- Page 107 and 108:
3.8 Plotting Simple Graphs 93 >> X
- Page 109 and 110:
3.8 Plotting Simple Graphs 95 90 18
- Page 111:
3.8 Plotting Simple Graphs 97 EXERC
- Page 114 and 115:
100 Programming in MATLAB: Scripts
- Page 116 and 117:
102 Programming in MATLAB: Scripts
- Page 118 and 119:
104 Programming in MATLAB: Scripts
- Page 120 and 121:
106 Programming in MATLAB: Scripts
- Page 122 and 123:
108 Programming in MATLAB: Scripts
- Page 124 and 125:
110 Programming in MATLAB: Scripts
- Page 126 and 127:
112 Programming in MATLAB: Scripts
- Page 128 and 129:
114 Programming in MATLAB: Scripts
- Page 130 and 131:
116 Programming in MATLAB: Scripts
- Page 132 and 133:
118 Programming in MATLAB: Scripts
- Page 134 and 135:
120 Programming in MATLAB: Scripts
- Page 136 and 137:
122 Programming in MATLAB: Scripts
- Page 138 and 139:
124 Programming in MATLAB: Scripts
- Page 140 and 141:
126 Programming in MATLAB: Scripts
- Page 142 and 143:
128 Programming in MATLAB: Scripts
- Page 144 and 145:
130 Programming in MATLAB: Scripts
- Page 146 and 147:
132 Programming in MATLAB: Scripts
- Page 149 and 150:
• Applications 5.1 Linear Algebra
- Page 151 and 152:
5.1 Linear Algebra 137 augmented ma
- Page 153 and 154: 5.2 Curve Fitting and Interpolation
- Page 155 and 156: 5.2 Curve Fitting and Interpolation
- Page 157 and 158: 5.2 Curve Fitting and Interpolation
- Page 159 and 160: 5.2 Curve Fitting and Interpolation
- Page 161 and 162: 5.2 Curve Fitting and Interpolation
- Page 163 and 164: 5.2 Curve Fitting and Interpolation
- Page 165 and 166: 5.3 Data Analysis and Statistics 15
- Page 167 and 168: 5.4 Numerical Integration (Quadratu
- Page 169 and 170: 5.4 Numerical Integration (Quadratu
- Page 171 and 172: 5.5 Ordinary Differential Equations
- Page 173 and 174: 5.5 Ordinary Differential Equations
- Page 175 and 176: 5.5 Ordinary Differential Equations
- Page 177 and 178: 5.5 Ordinary Diffe rential Equation
- Page 179 and 180: 5.5 Ordinary Differential Equations
- Page 181 and 182: 5.5 Ordinary Differential Equations
- Page 183 and 184: 5.6 Nonlinear Algebraic Equations 1
- Page 185 and 186: 5. 7 Advanced Topics 171 Finding mu
- Page 187: 5. 7 Advanced Topics 173 • First,
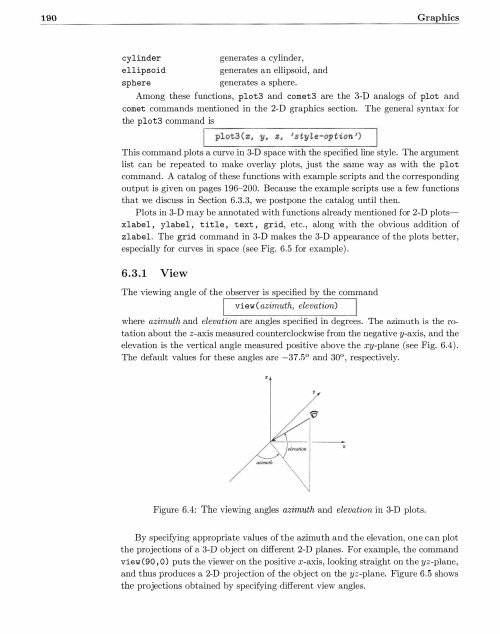
- Page 190 and 191: 176 Graphics 6.1.1 Style options Th
- Page 192 and 193: 178 Graphics Semi-control of axes I
- Page 194 and 195: 180 Graphics rt;; tiinspZlcE! ( O ;
- Page 196 and 197: 182 Graphics Fun with sin(t) 5,----
- Page 198 and 199: 184 Graphics Function Example Scrip
- Page 200 and 201: 186 Graphics Function Example Scrip
- Page 202 and 203: 188 comet contour quiver Example Sc
- Page 206 and 207: 192 Graphics View(2) and view(3) Th
- Page 208 and 209: 194 Graphics of grid points. Also,
- Page 210 and 211: I 196 Graphics [Function Example Sc
- Page 212 and 213: I 198 Graphics Function Example Scr
- Page 214 and 215: 200 Graphics Function Example Scrip
- Page 216 and 217: 202 Graphics where (x, y, z) are 3-
- Page 218 and 219: 204 Graphics % SURFINTERP : script
- Page 220 and 221: 206 Graphics The Root The Graphics
- Page 222 and 223: 208 Graphics » t = linspace (O,pi,
- Page 224 and 225: 210 Graphics 6.4.4 Modifying an exi
- Page 226 and 227: 212 Graphics 6.4.5 Complete control
- Page 228 and 229: 214 Graphics elf hi = axes ('posit
- Page 230 and 231: 216 Graphics Surface plotting funct
- Page 232 and 233: 218 Graphics fiat lighting, each pa
- Page 234 and 235: 220 Graphics 6.6.1 Saving graphs to
- Page 236 and 237: 222 Graphics two important things t
- Page 238 and 239: 224 Graphics Example 2: The bead go
- Page 240 and 241: 226 Graphics Example 4: The bar pen
- Page 243 and 244: • Errors Errors are an integral p
- Page 245 and 246: Errors 231 In matrix multiplication
- Page 247: Errors 233 7. >> X = b+2 .33 ??? Un
- Page 250 and 251: 236 Computer Algebra and The Symbol
- Page 252 and 253: 238 Computer Algebra and The Symbol
- Page 254 and 255:
240 Computer Algebra and The Symbol
- Page 256 and 257:
242 Computer Algebra and The Symbol
- Page 258 and 259:
244 Computer Algebra and The Symbol
- Page 260 and 261:
246 Computer Algebra and The Symbol
- Page 262 and 263:
248 Computer Algebra and The Symbol
- Page 264 and 265:
Honorable • Mentions There are ma
- Page 266 and 267:
252 The MATLAB Language Reference '
- Page 268 and 269:
254 The MATLAB Language Reference A
- Page 270 and 271:
256 The MATLAB Language Reference A
- Page 272 and 273:
258 The MATLAB Language Reference ;
- Page 274 and 275:
260 The MATLAB Language Reference A
- Page 277 and 278:
Index !, 7, 252 \ , 73 ' (right quo
- Page 279 and 280:
Index 265 dblquad, 154 dde23, 171 d
- Page 281 and 282:
Index 267 helpdesk, 7, 12, 85, 90,
- Page 283 and 284:
Index 269 more, 9, 12, 27, 64 movie
- Page 285 and 286:
Index 271 spy, 97 sqrt, 76 sqrtm, 7