TRAFFICKING IN PERSONS
1Spfyta
1Spfyta
Create successful ePaper yourself
Turn your PDF publications into a flip-book with our unique Google optimized e-Paper software.
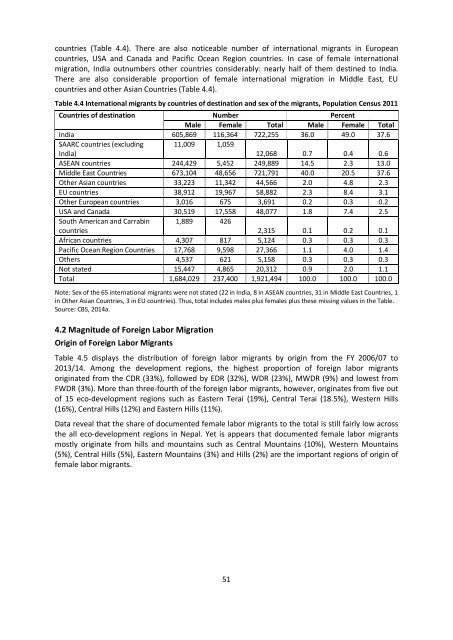
Top 10 Districts for Female Foreign Labor Migrants<br />
Unlike the total foreign labor migrants by districts, the female foreign labor migrants show a<br />
different picture. It is mostly the hills/mountains districts with the highest proportion of female labor<br />
migrants such as Sindhupalchok, Makwanpur, Kathmandu, Kavre, Nuwakot and Illam (Figure 3.1).<br />
These 10 districts alone share 50 percent of documented female foreign labor migrants of Nepal in<br />
between FY 2006/07 and 2013/14. Although data on the foreign labor migrants by caste/ethnicity is<br />
not available from the DoFE, it appears that it is mostly the hills origin females over Madheshi ones<br />
migrating for employment abroad. Several sociological literature suggest that there is relatively<br />
much cultural relaxation of the hills/mountain origin females especially among Janajati and Dalit to<br />
work outside of the house against females belonging to Madheshi community. This is also confirmed<br />
from Population Census 2011 data that the crude economic activity rate for females is more than 3<br />
times lower in Terai (15%) compared to hills (43%) and mountains (51%) (CBS, 2014c).<br />
Source: Department of Foreign Employment (2014) Annual Report of FY 2070/71 (2013/14).<br />
Countries of Destination<br />
According to the Annual Report 2014 of Department of Foreign Employment, the GoN has opened<br />
110 countries for work abroad. These countries consist of Europe, North America, Latin America,<br />
Africa, Asia and Australia continents (See Appendix 4.2 for individual countries).<br />
Table 4.7 Number of foreign labor migrants by sex in FY 2014/15 and stock of migrants (2006/07-2014/15),<br />
Nepal<br />
Country Annual Flow in 2014/15 Stock (2006/07-2014/15)<br />
Male Female Total % of<br />
total<br />
Male Female Total % of<br />
total<br />
Qatar 122,050 2,318 124,368 24.2 705,940 6,317 712,257 23.5<br />
Malaysia 196,929 5,899 202,828 39.5 1,145,467 23,946 1,169,413 38.6<br />
Saudi Arabia 97,570 676 98,246 19.2 613,172 1,870 615,042 20.3<br />
UAE 46,105 7,594 53,699 10.5 321,616 24,445 346,061 11.4<br />
Kuwait 8,750 918 9,668 1.9 50,834 1,932 52,766 1.7<br />
Bahrain 3,623 542 4,165 0.8 29,547 1,578 31,125 1.0<br />
Oman 1,873 427 2,300 0.4 14,612 915 15,527 0.5<br />
South Korea 4,804 354 5,158 1.0 5,941 426 6,367 0.2<br />
Lebanon 136 462 598 0.1 2,745 3,543 6,288 0.2<br />
Israel 131 319 450 0.1 18,179 3,397 21,576 0.7<br />
Afghanistan 1,495 6 1,501 0.3 4,280 6 4,286 0.1<br />
Japan 2,742 94 2,836 0.6 3,032 403 3,435 0.1<br />
Others 4,651 2,419 7,070 1.4 38,378 5,587 43,965 1.5<br />
Total 490,859 22,028 512,887 100.0 2,953,743 74,365 3,028,108 100.0<br />
Source: data for FY 2014/15, http://www.dofe.gov.np/new/pages/details/34 (accessed on November 30, 2015) and<br />
Department of Foreign Employment (2014) Annual Report of FY 2070/71 (2013/14).<br />
53


