

TRAFFICKING IN PERSONS
1Spfyta
1Spfyta

Create successful ePaper yourself
Turn your PDF publications into a flip-book with our unique Google optimized e-Paper software.
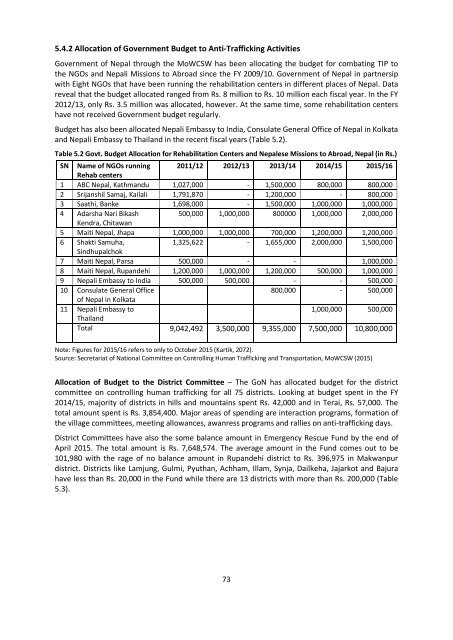
Number of Survivors Provided Services - Table 5.4 shows the number of trafficked survivors<br />
provided services by the NGOs supported by the Government. The GoN has allocated budget for the<br />
running of eight rehabilitation centers in eight districts since the FY 2009/10. These rehabilitation<br />
centers have provided services to a substantial number of the survivors in each FY. The number of<br />
survivors provided services ranged from 740 in FY 2013/14 to 1311 in FY 2011/12 and to 1012 in FY<br />
2015/16. The number of survivors provided services varied by district in which rehabilitation centers<br />
are in operation. The five-yearly average number of survivors provided services (2011/12-2015/16) is<br />
the highest in Jhapa (356), followed by Banke (190), Rupandehi (183), Parsa (155), Chitawan (73),<br />
Sindhupalchok (71) and the lost in Kathmandu and Kailali (28 in each).<br />
Table 5.4 Number of trafficked survivors provided support by Govt supported NGOs<br />
District in which rehab<br />
centers in operation<br />
2011/12 2012/13 2013/14 2014/15 2015/16* Five-yearly<br />
average number<br />
(2011/12-2015/16)<br />
Rupandehi 195 233 157 90 242 183<br />
Sindhupalchok 66 19 25 231 13 71<br />
Chitawan 43 107 109 13 93 73<br />
Kathmandu 69 8 14 28 21 28<br />
Banke 254 254 126 165 152 190<br />
Parsa 240 176 68 114 179 155<br />
Kailali 32 26 29 18 37 28<br />
Jhapa 412 635 212 244 275 356<br />
Total 1311 1458 740 903 1012<br />
Note: Figures for 2015/16 refers to only to October 2015 (Kartik, 2072).<br />
Source: Secretariat of National Committee on Controlling Human Trafficking and Transportation, MoWCSW (2015)<br />
Budget Allocated Per Survivor - Table 5.5 shows the government allocation of budget to the<br />
rehabilitation centers from the FY 2011/12 to FY 2015/16 vis-à-vis total number of trafficked<br />
survivors provided services by these rehabilitation centers. The five-yearly (2011/12-2015/16)<br />
average amount allocated is Rs. 7.2 million and the five-yearly average number of trafficked<br />
survivors provided services is 1,085. The five-yearly average Rs. allocated per survivor comes out to<br />
be Rs. 6,617 with ranging from Rs. 2,058 in FY 2012/13 to Rs. 1,1561 in the FY 2013/14.<br />
Table 5.5 Government Budget allocation to the rehabilitation centers per survivor<br />
FY Total budget allocated Total survivors provided<br />
services<br />
Annual budget allocated<br />
per survivor<br />
2011/12 8,542,492 1,311 6516<br />
2012/13 3,000,000 1,458 2058<br />
2013/14 8,555,000 740 11561<br />
2014/15 6,500,000 903 7198<br />
2015/16 9,300,000 1,012 9190<br />
Five-yearly average<br />
(2011/12-2015/16)<br />
7,179,498 1,085<br />
6617<br />
Source: calculated based on Table 5.2 and 5.3.<br />
75