Arendt und Zannini - 2013 - Cereal grains for the food and beverage industries
Arendt und Zannini - 2013 - Cereal grains for the food and beverage industries
Arendt und Zannini - 2013 - Cereal grains for the food and beverage industries
Create successful ePaper yourself
Turn your PDF publications into a flip-book with our unique Google optimized e-Paper software.
Rice 127<br />
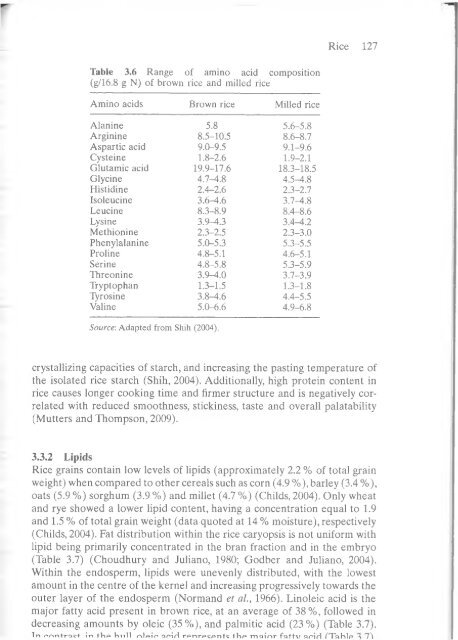
Table 3.6 Range of amino acid composition<br />
(g/16.8 g N) of brown rice <strong>and</strong> milled rice<br />
Amino acids Brown rice Milled rice<br />
Alanine 5.8 5.6-5.S<br />
Arginine 8.5-10.5 S.6-8.7<br />
Aspartic acid 9.0-9.5 9.1-9.6<br />
Cysteine 1.8- 2.6 1.9-2.1<br />
Glutamic acid 19.9-17.6 18.3-18.5<br />
Glycine 4.7-4.8 4.5^.8<br />
Histidine 2.4-2.6 2.3-2.7<br />
Isoleucine 3.6-4.6 3.7-4.S<br />
Leucine 8.3-S.9 8.4-S.6<br />
Lysine 3.9-4.3 3.4^.2<br />
Methionine 2.3-2.5 2.3-3.0<br />
Phenylalanine 5.0-5.3 5.3-5.5<br />
Proline 4.8-5.1 4.6-5.1<br />
Serine 4.8-S.8 5.3-5.9<br />
Threonine 3.9-4.0 3.7-3.9<br />
Tryptophan 1.3-1.5 1.3-1.8<br />
Tyrosine 3.S-4.6 4.4-5.5<br />
Valine 5.0-6.6 4.9-6.8<br />
Source'. Adapted from Shih (2004).<br />
crystallizing capacities of starch, <strong>and</strong> increasing <strong>the</strong> pasting temperature of<br />
<strong>the</strong> isolated rice starch (Shih, 2004). Additionally, high protein content in<br />
rice causes longer cooking time <strong>and</strong> firmer structure <strong>and</strong> is negatively correlated<br />
with reduced smoothness, stickiness, taste <strong>and</strong> overall palatability<br />
(Mutters <strong>and</strong> Thompson, 2009).<br />
3.3.2 Lipids<br />
Rice <strong>grains</strong> contain low levels of lipids (approximately 2.2 % of total grain<br />
weight) when compared to o<strong>the</strong>r cereals such as corn (4.9 %),barley (3.4 %),<br />
oats (5.9 %) sorghum (3.9 %) <strong>and</strong> millet (4.7 %) (Childs, 2004). Only wheat<br />
<strong>and</strong> rye showed a lower lipid content, having a concentration equal to 1.9<br />
<strong>and</strong> 1.5 % of total grain weight (data quoted at 14 % moisture), respectively<br />
(Childs, 2004). Fat distribution within <strong>the</strong> rice caryopsis is not uni<strong>for</strong>m with<br />
lipid being primarily concentrated in <strong>the</strong> bran fraction <strong>and</strong> in <strong>the</strong> embryo<br />
(Table 3.7) (Choudhury <strong>and</strong> Juliano, 1980; Godber <strong>and</strong> Juliano, 2004).<br />
Within <strong>the</strong> endosperm, lipids were unevenly distributed, with <strong>the</strong> lowest<br />
amount in <strong>the</strong> centre of <strong>the</strong> kernel <strong>and</strong> increasing progressively towards <strong>the</strong><br />
outer layer of <strong>the</strong> endosperm (Norm<strong>and</strong> et al., 1966). Linoleic acid is <strong>the</strong><br />
major fatty acid present in brown rice, at an average of 38%, followed in<br />
decreasing amounts by oleic (35 %), <strong>and</strong> palmitic acid (23%) (Table 3.7).<br />
T n r>/-\r»trocL iti t liA l-in ll rtl/air» Ckf*\A rp rirF ^ C A n tc t h p m a i n r f i i t t v nr*iH /"X n h lp ‘1\


