

Maths
hjtyqbs
hjtyqbs

Create successful ePaper yourself
Turn your PDF publications into a flip-book with our unique Google optimized e-Paper software.
Power of <strong>Maths</strong>: Paper 1 – Section 1<br />
Activity 13: Understanding direct<br />
proportion<br />
OBJECTIVE: To draw a graph from a table of results and to answer questions that involve direct<br />
proportionality<br />
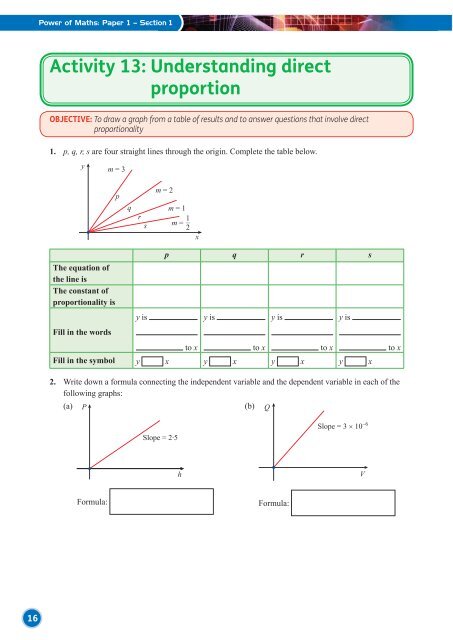
1. p, q, r, s are four straight lines through the origin. Complete the table below.<br />
y<br />
m = 3<br />
p<br />
q<br />
r<br />
s<br />
m = 2<br />
m = 1<br />
1<br />
m = –<br />
2<br />
x<br />
The equation of<br />
the line is<br />
The constant of<br />
proportionality is<br />
Fill in the words<br />
y is<br />
p q r s<br />
to x<br />
y is<br />
Fill in the symbol y x y x y x y x<br />
to x<br />
y is<br />
to x<br />
y is<br />
to x<br />
2. Write down a formula connecting the independent variable and the dependent variable in each of the<br />
following graphs:<br />
(a) P<br />
(b) Q<br />
Slope = 2·5<br />
Slope = 3 × 10 −6<br />
h<br />
V<br />
Formula:<br />
Formula:<br />
16