

Maths
hjtyqbs
hjtyqbs

Create successful ePaper yourself
Turn your PDF publications into a flip-book with our unique Google optimized e-Paper software.
Number<br />
1<br />
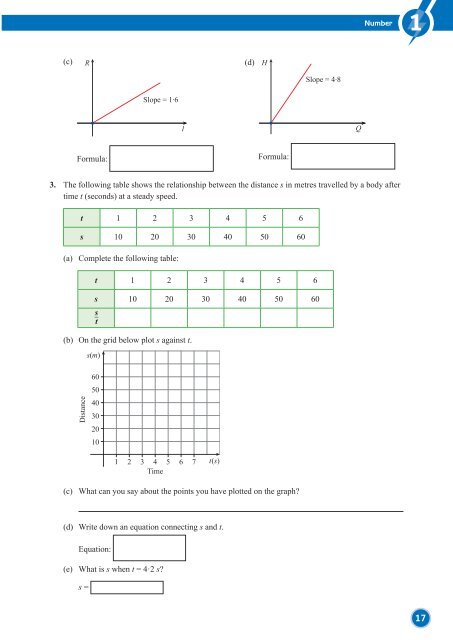
(c)<br />
R<br />
(d) H<br />
Slope = 4·8<br />
Slope = 1·6<br />
l<br />
Q<br />
Formula:<br />
Formula:<br />
3. The following table shows the relationship between the distance s in metres travelled by a body after<br />
time t (seconds) at a steady speed.<br />
t 1 2 3 4 5 6<br />
s 10 20 30 40 50 60<br />
(a) Complete the following table:<br />
t 1 2 3 4 5 6<br />
s 10 20 30 40 50 60<br />
s_<br />
t<br />
(b) On the grid below plot s against t.<br />
s(m)<br />
Distance<br />
60<br />
50<br />
40<br />
30<br />
20<br />
10<br />
1 2 3 4 5 6 7<br />
Time<br />
t(s)<br />
(c) What can you say about the points you have plotted on the graph?<br />
(d) Write down an equation connecting s and t.<br />
Equation:<br />
(e) What is s when t = 4·2 s?<br />
s =<br />
17