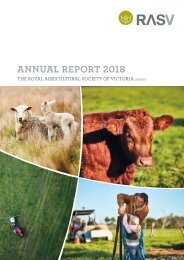
2016 RASV Annual Report
The Royal Agricultural Society of Victoria (RASV) promotes and celebrates agriculture through events which connect industry with consumers and ultimately aims to improve the quality and increase demand for Victorian agricultural produce.
The Royal Agricultural Society of Victoria (RASV) promotes and celebrates agriculture through events which connect industry with consumers and ultimately aims to improve the quality and increase demand for Victorian agricultural produce.

You also want an ePaper? Increase the reach of your titles
YUMPU automatically turns print PDFs into web optimized ePapers that Google loves.
15. FINANCIAL INSTRUMENTS (cont.)<br />
The entity holds the following financial instruments:<br />
<strong>2016</strong> 2015<br />
$ $<br />
Financial Assets:<br />
Cash and Cash Equivalents 7,353,464 7,318,115<br />
Receivables 320,879 466,568<br />
Total Financial Assets 7,674,343 7,784,683<br />
Financial Liabilities:<br />
Trade and Other Payables 2,562,769 3,287,890<br />
Interest Bearing Liabilities 96,869 106,302<br />
Total Financial Liabilities 2,659,638 3,394,192<br />
Net Exposure 5,014,705 4,390,491<br />
As of 31 March <strong>2016</strong> the Company had net financial instrument assets of $5,014,705. The directors of the <strong>RASV</strong> believe that the Company<br />
will be able to settle the liabilities summarised above as and when they fall due.<br />
(b) Risk Exposures and Responses<br />
Interest Rate Risk<br />
The entity’s exposure to market interest rates relates primarily to short term deposits held.<br />
Management monitors term deposit rates and balances the achievement of high rates against the flexibility offered by at call funds.<br />
Sensitivity analysis<br />
Management are of the opinion that applying a sensitivity analysis rate of 1% is a reasonable estimate of the uncertainty in the market<br />
over the next twelve months.<br />
At 31 March, if interest rates had moved, as illustrated in the table below, with all other variables held constant, post tax loss and equity<br />
would have been affected as follows:<br />
Net Loss Higher / (Lower)<br />
Net Assets Higher / (Lower)<br />
Year Ended 31 March<br />
As at 31 March<br />
<strong>2016</strong> 2015 <strong>2016</strong> 2015<br />
$ $ $ $<br />
+1% (100 basis points) (73,535) (73,181) 73,535 73,181<br />
-1% (100 basis points) 73,535 73,181 (73,535) (73,181)<br />
<strong>Annual</strong> <strong>Report</strong> <strong>2016</strong> 65