Making Every Baby Count
9789241511223-eng
9789241511223-eng

Create successful ePaper yourself
Turn your PDF publications into a flip-book with our unique Google optimized e-Paper software.
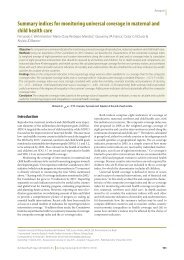
There are multiple tools available for completing a root cause analysis. One of the most<br />
helpful is called an Ishikawa diagram, which is also known as a “fishbone” diagram,<br />
because a completed diagram can look like the skeleton of a fish (see Figure A4–1).<br />
Steps for a group to complete a root cause analysis through a fishbone diagram:<br />
Step 1: Record the event at the head<br />
The first step is to identify the problem or event – for example, a death with a specific<br />
cause, such as an intrapartum-related perinatal death in a full-term baby. Write this problem<br />
in a box on the far right-hand side of a large sheet of paper as the “head” of the fish, to<br />
represent the event that is under investigation for contributing problems and factors, and<br />
then draw a line across the paper horizontally from the box as the “spine” of the fish.<br />
Step 2: Brainstorm contributing factors<br />
Next, draw lines as “bones” off the spine of the fish with a box at the end of each line/<br />
bone in which to write down the contributing factors. The group then attempts to identify<br />
the problems and factors that led to the perinatal death. These may be problems at different<br />
levels of the health systems, or system building blocks such as staffing, equipment,<br />
information, etc. Identifying the contributing factors is typically done through open brainstorming,<br />
with every person in the group contributing out loud everything that they can<br />
think of that contributed to the occurrence of this death. Alternatively, instead of contributing<br />
out loud, groups may choose to have participants write down what they think the<br />
contributing factors to the death were and then submit them anonymously to a discussion<br />
leader who can read them out loud.<br />
The National Health Service (NHS) of England has developed a list of potential contributing<br />
factors which is is provided to participants in its National Patient Safety Agency to<br />
FIGURE A4–1. Fishbone diagram<br />
94 MAKING EVERY BABY COUNT: AUDIT AND REVIEW OF STILLBIRTHS AND NEONATAL DEATHS